

The Tanks Are Opening. The Curve Is Breaking.
Four hundred million barrels cannot replace a physical chokepoint.

Barrels in a salt cavern are not barrels on a tanker. Release speed is the constraint nobody is modelling.
On Thursday morning, I watched Brent crude collapse toward $97 intraday after the IEA announced the largest coordinated reserve release in history. By Friday’s close, the front-month contract violently ripped back above $103. The paper market flinched at the sheer volume of 400 million barrels. Physical operators, the guys I used to work alongside, simply did the math. The Strait of Hormuz chokepoint handles 20 million barrels per day of flow, and this week it is functionally closed.
The consensus entering this week was that strategic reserves would instantly crush the rally and force prices lower. But when the market stops believing its own story, three things happen. Capital flees the headline trade. Spreads invert violently. The physical reality of logistics and pipeline capacity overrides the political press release.
Here is what almost everyone missed this week. Barrels sitting in a Gulf Coast salt cavern are not barrels loaded on a VLCC. Release speed is the ultimate constraint, and the U.S. pipeline infrastructure simply cannot move those strategic barrels fast enough to plug an immediate 8-million-barrel-per-day supply gap.
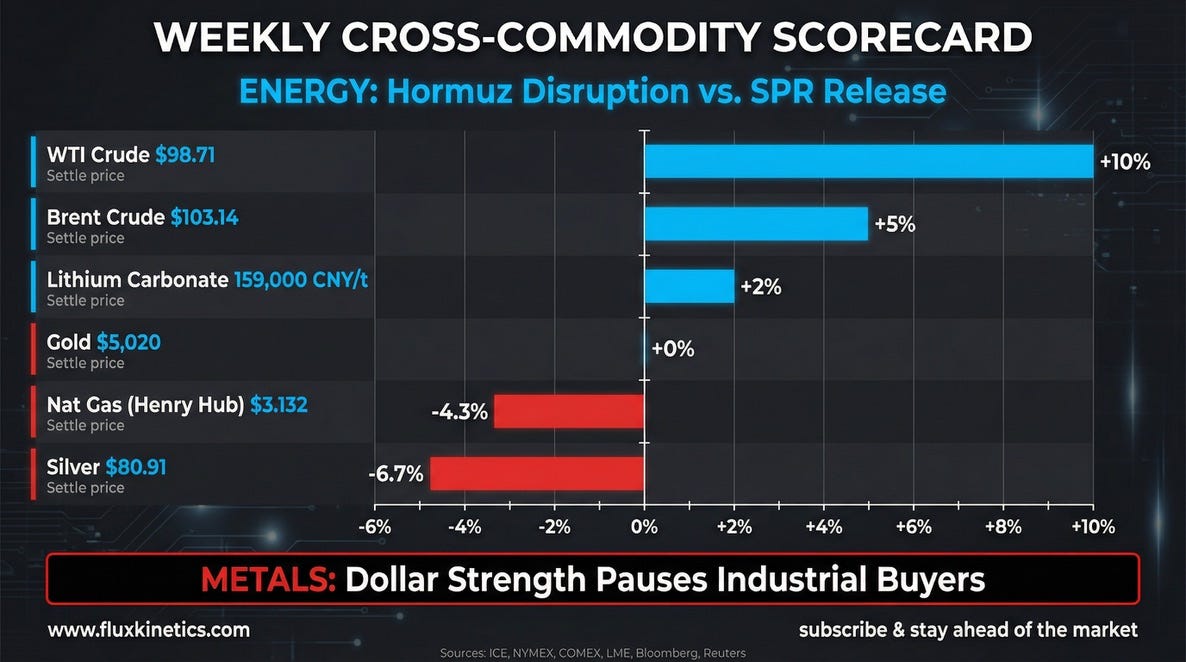
This Week’s Settle
Oil: Brent settled sharply higher at $103.14 (+7.7% weekly), recovering violently from Thursday’s SPR headline as the massive $10 backwardation forced physical buyers to secure prompt supply. WTI closed higher at $98.71 (+8.8% weekly), trailing Brent as the localised influx of U.S. strategic reserves capped the domestic upside.
Gas: Henry Hub finished softer at $3.13 (-3.1% weekly), completely insulated from the global energy chaos as robust Permian associated gas absorbed new LNG feed demand without tightening the broader grid.
Gold: Settled lower at $5,020/oz (-2.0% weekly), testing the five-thousand floor as a surging dollar and rising real yields temporarily overpowered safe-haven physical accumulation.
Silver: Gapped lower to $80.54/oz (-5.5% weekly), leading the metals correction as the widening 62:1 ratio signals industrial buyers are pausing procurement at these levels.
Lithium: China battery-grade lithium carbonate closed flat at 159,000 CNY/tonne ($21,800 USD) (+0.6% weekly), establishing a hard floor this week as data-center stationary storage demand quietly replaced fading EV growth.
Brief Contents
The Oil and Curve Story
The LNG and Infrastructure Story
The Metals and Critical Minerals Story
Chokepoints and Capital Flows
The Flux Conviction
Week Ahead: What to Watch
Action Items
The molecules do not care about press conferences. They care about pipeline diameter.
THE OIL AND CURVE STORY
The IEA’s Thursday announcement authorised 400 million barrels of strategic petroleum from 31 member countries. The U.S. committed 172 million barrels. Deliveries are scheduled to start hitting the Gulf Coast within ten days. The paper market digested this massive headline and kept bidding the physical barrel anyway.
I spent years looking at terminal throughput models, and I can tell you that release rate matters more than total volume. The U.S. Strategic Petroleum Reserve can physically release about 4.4 million barrels per day at maximum flow rate from its Gulf Coast salt caverns.
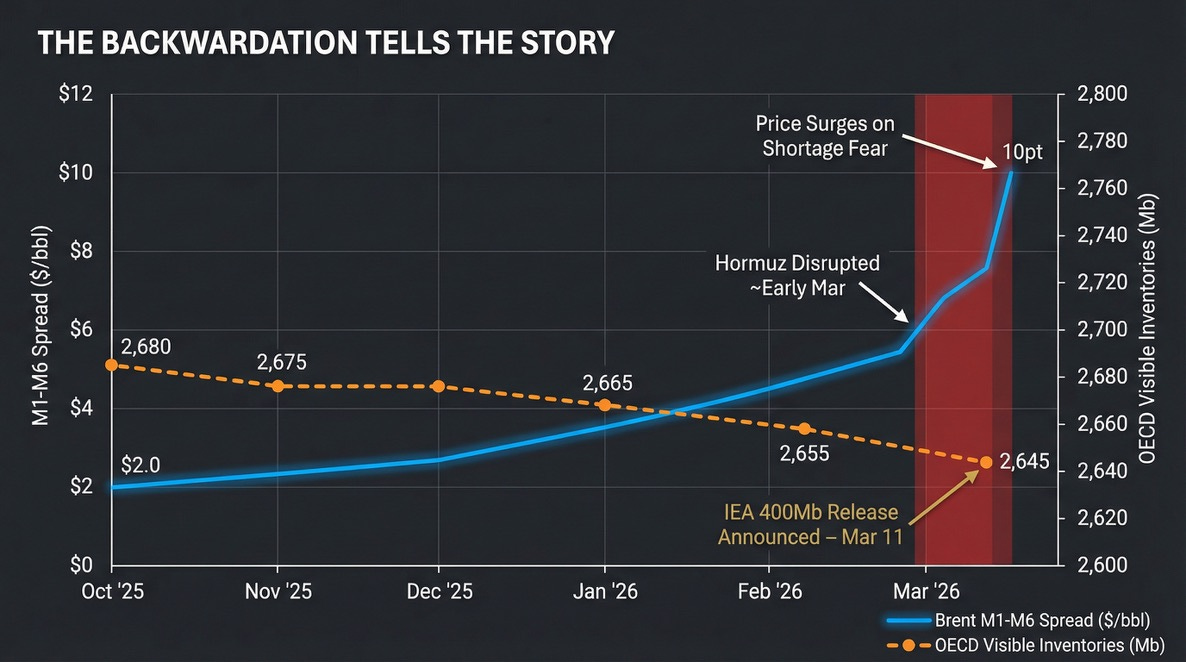
Coordinating 31 countries with different infrastructure and pipeline specifications means the actual combined global release rate will land closer to 3 million barrels per day. Against a Hormuz disruption removing roughly 8 million barrels per day from the physical market this week, that leaves a massive net deficit of 5 to 6 million barrels per day.
The arithmetic is brutal. The curve is doing the arithmetic.
The backwardation tells the entire story. Brent’s six-month spread widened to $10 this week, the steepest since early 2022. When the curve is this steep, it screams for immediate molecules. Strategic reserves are slow molecules. The market needs fast ones. Refiners are running hard at 90.8% utiliaation because crack spreads are printing money, and they cannot afford a feedstock gap. Gasoline stocks drew 3.7 million barrels. Distillates drew 1.3 million barrels. Jet fuel demand surged 7.3% year-on-year.
The Number: 8 million barrels per day. That is the physical hole. The headline says 400 million barrels covers it, but the math says release logistics will stretch that volume over four months of inadequate offset.
Subscribe to Flux Kinetics and get this briefing every Sunday before the market opens. No noise, no filler, just the signal that energy professionals actually use.
THE LNG AND INFRASTRUCTURE STORY
While the world watched the Strait of Hormuz, the U.S. Gulf Coast quietly rewired the global gas arbitrage. The Golden Pass LNG terminal hit 300 million cubic feet per day of feed-gas intake this week. Exxon confirmed first LNG production is weeks away.
This terminal pulls entirely new demand on the Gulf Coast pipeline grid. Train 1 alone requires roughly 700 million cubic feet per day at full rate. Yet Henry Hub settled at $3.13. The feed-gas pull is being completely absorbed by Permian associated gas production. The domestic market barely felt it.
Asian JKM LNG spot prices are sitting above $14/MMBtu. Even after liquefaction tolling and shipping costs, the netback to a Gulf Coast seller is north of $8.00. Every single cargo Golden Pass produces in Q2 will price at war-premium levels. The economics are printing $5-per-MMBtu-plus netbacks. Every midstream operator with pipe in the ground knows it.
The Insider View: The bifurcation is that equities priced in a saturated domestic gas market years ago while the physical market only now feels the massive arbitrage window opening for midstream operators. Golden Pass is the ninth operational U.S. LNG terminal. It is also the first to start up during an active supply crisis.
Watch how Daniel Yergin explains the physical bottleneck mechanics of the Hormuz closure and why oil briefly spiked past $115 in a single session:
THE METALS AND CRITICAL MINERALS STORY
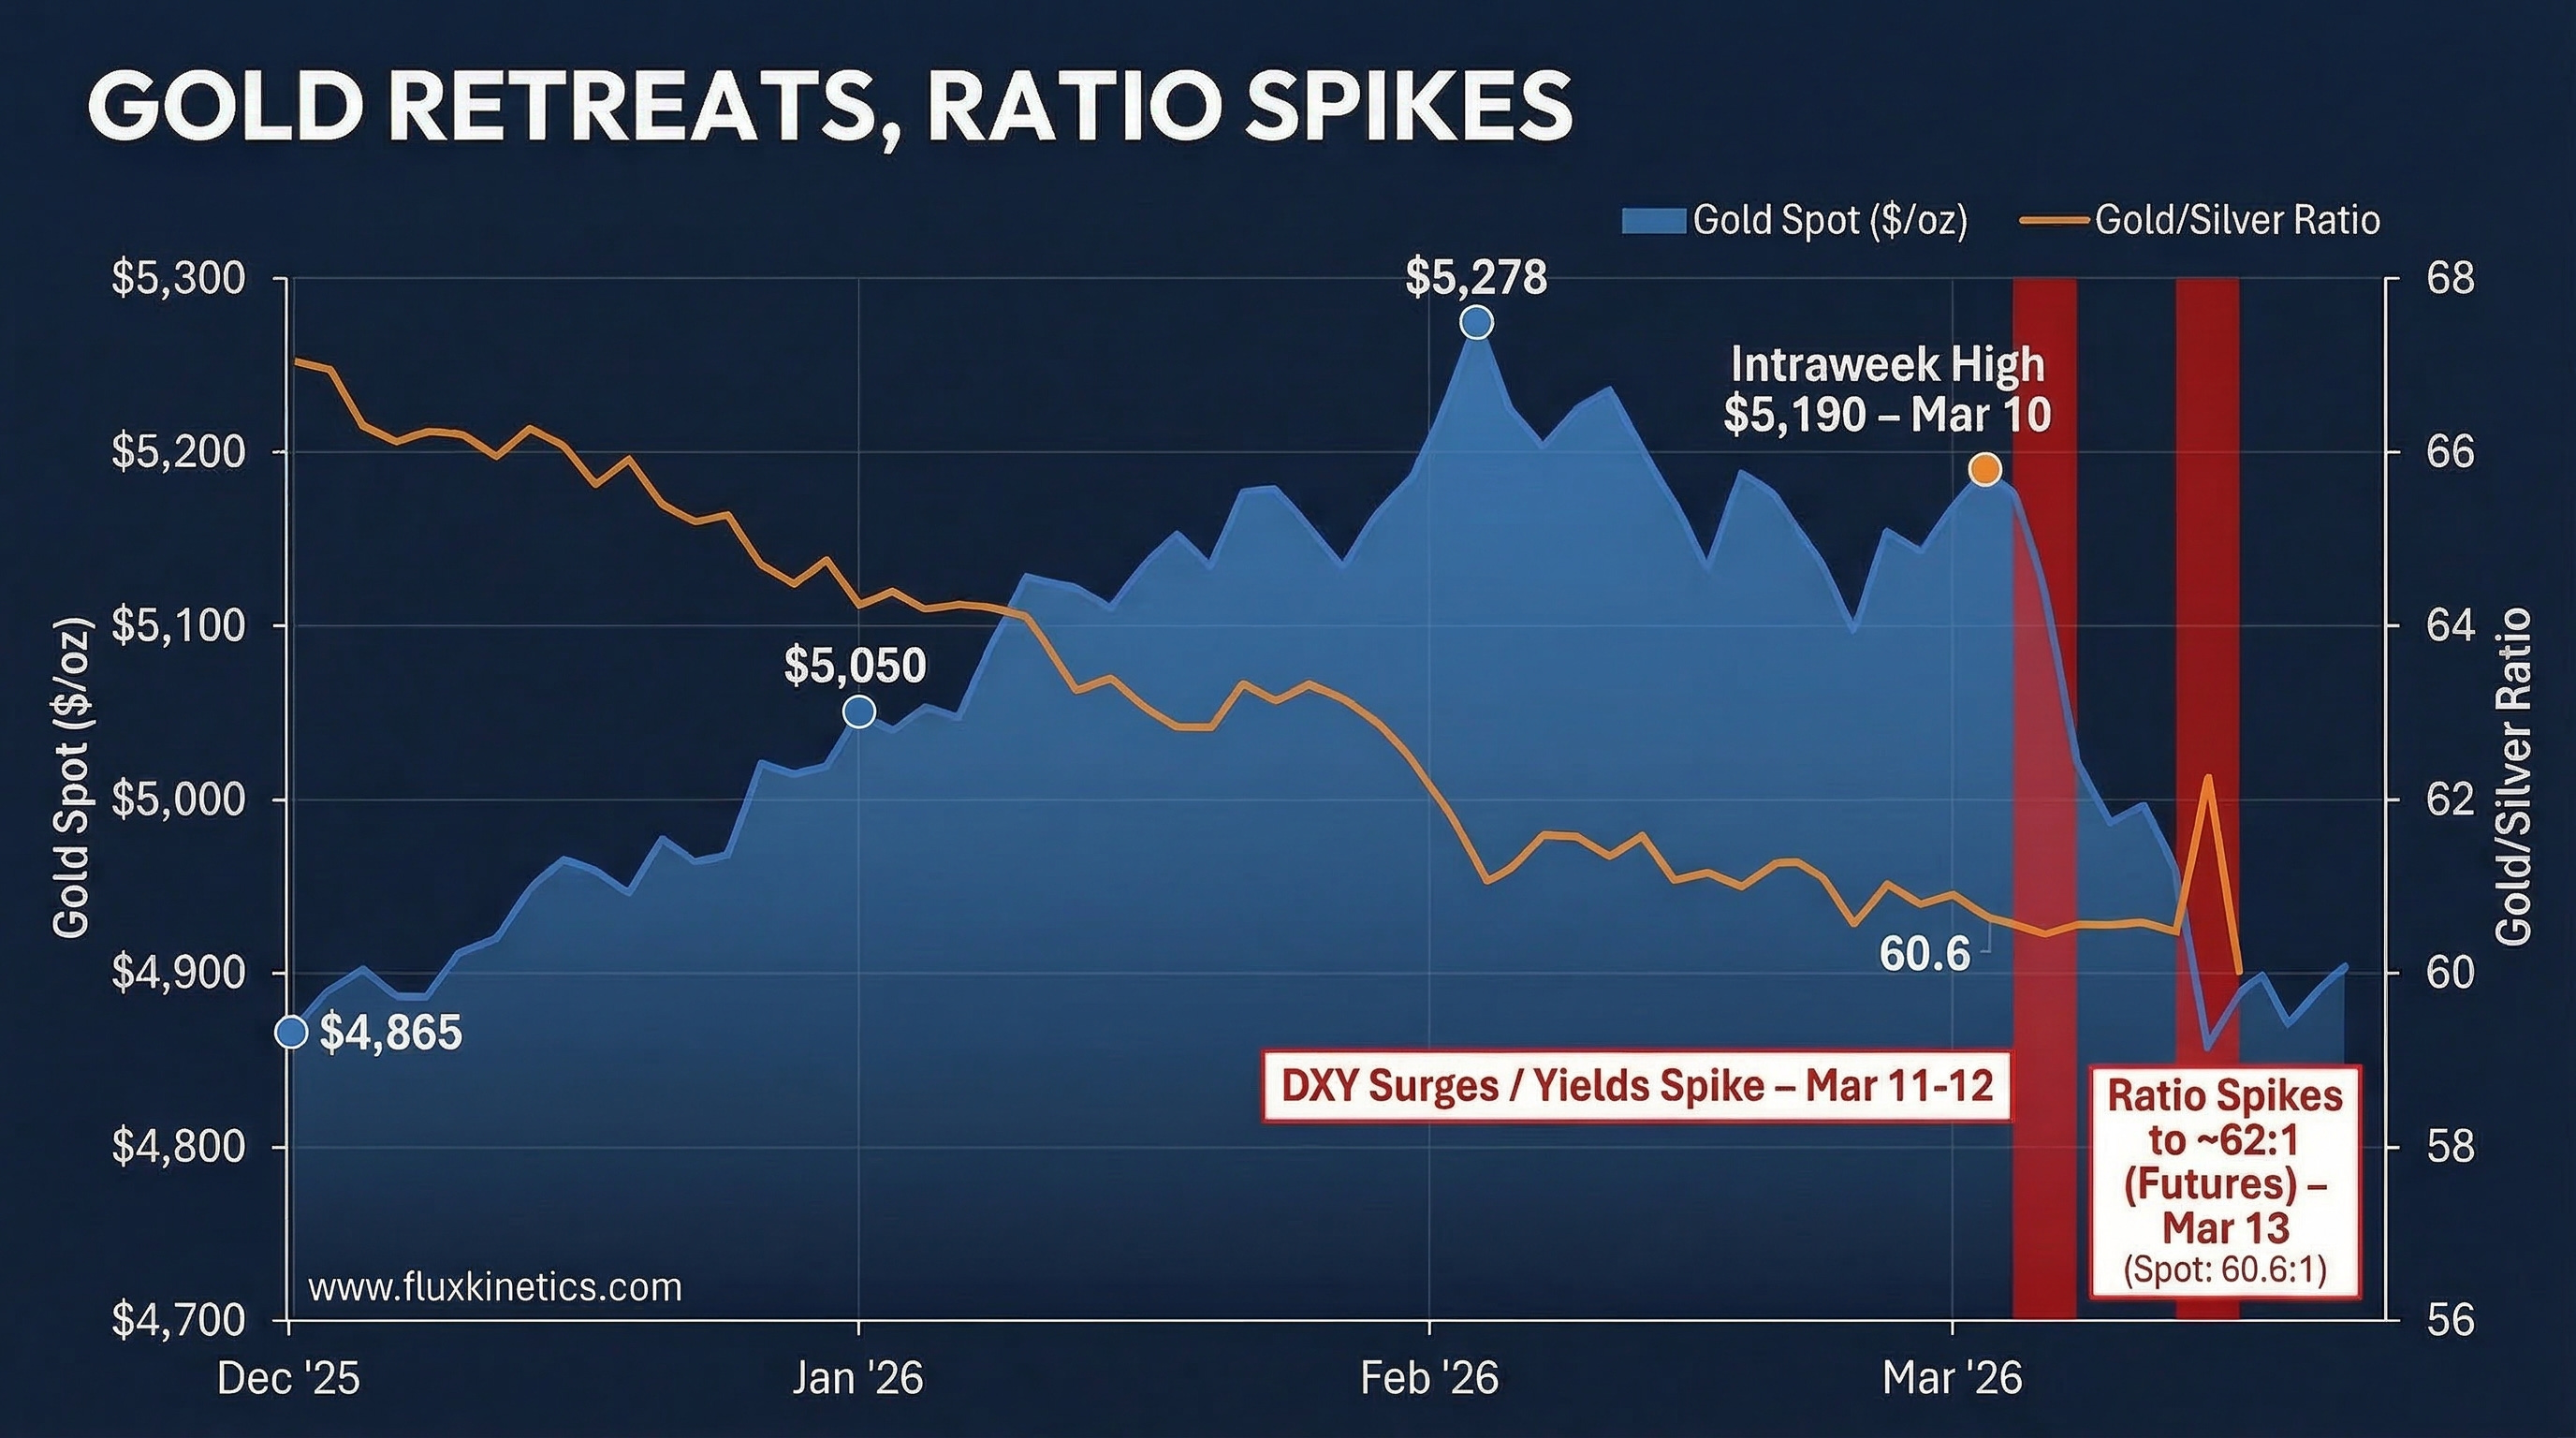
Gold dropped from Monday’s $5,114 high to settle at $5,020. The proximate cause was pure dollar strength. The DXY index firmed sharply this week. Real yields on the 10-year TIPS ticked above 2.1%, pulling institutional capital toward bonds and temporarily starving non-yielding metals.
Silver took a much worse beating. It fell back to $80.54. The gold-to-silver ratio pushed above 62:1 this week. When that ratio widens this aggressively, physical silver buyers are stepping back and waiting for a better entry. They are pausing industrial procurement.
This is where it breaks. The paper market is pricing precious metals purely on Fed rate expectations. The physical market is pricing a structural vault drain by central banks that has not stopped. The structural bid from sovereign buyers remains intact.
Lithium carbonate on the Guangzhou Futures Exchange held at 159,000 CNY/tonne, up 0.6% on the week. The market shrugged off a 13% single-day crash on March 3 and recovered within days. The floor is being set by data-center stationary storage procurement, not automotive demand. At $21,800 per tonne, lithium is pricing in zero EV growth. But the physical market is tightening around grid-storage orders. That is the asymmetry we look for at Flux Kinetics.
CHOKEPOINTS AND CAPITAL FLOWS
Three physical bottlenecks seized the market this week. Capital is violently repricing all of them.
First, Hormuz throughput. With millions of barrels disrupted, every alternative route is running at maximum capacity. Capital is flowing aggressively into tanker companies and pipeline operators that serve non-Hormuz routes.
Second, Gulf Coast terminal capacity. Golden Pass coming online absorbs pipeline capacity that was previously available to other terminals. Midstream companies with excess Gulf Coast pipe are repricing their tariffs upward right now.
Third, SPR release logistics. The U.S. reserve draws from four sites in Texas and Louisiana. Pipeline capacity from those specific sites to the coastal refineries is finite. A maximum draw rate assumes perfect pipeline availability. In practice, maintenance schedules and allocation conflicts will slow the physical barrels to market by weeks.
MY FLUX CONVICTION
When I worked the trading floor and linked it to my ground experience, the easiest way to lose your shirt was to trade a political headline without verifying the engineering behind it. We are seeing a massive bifurcation right now. The paper market is selling oil futures because 400 million barrels sounds like a flood. The physical market is buying prompt cargoes because 3 million barrels per day of cavern flow cannot fill an 8 million barrel per day maritime hole. Do not confuse the political announcement with the cycle. The constraint is the pipe, and the pipe always wins.
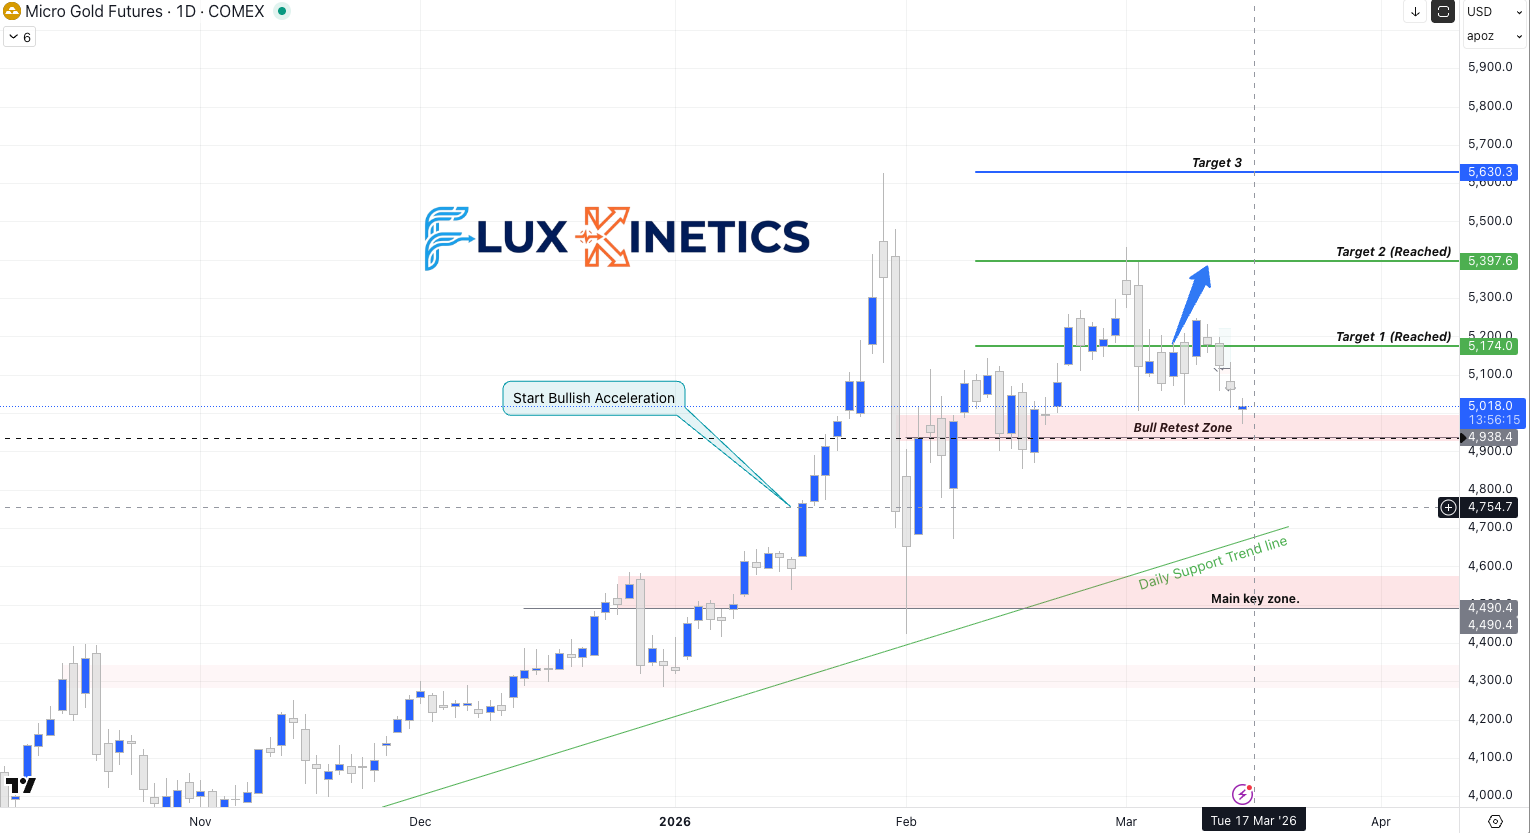
The Trade: Following our last week brief, the Target 1 line didn’t hold as a resistance and we are coming back now to this famous “Bull Retest Zone”. We need to keep an eye on U.S Dollar Index.
If I’m not already IN, this zone can be a great entry point with 4850$ as Stop Loss and Target 2 as a Take Profit : 3 to 4 Risk/Reward Ratio.
If I’m already holding a position, “Bull Retest Zone” is my last safety net to either cash out or take my loss.
Week Ahead: What to Watch
Monday March 16: China Industrial Production (Feb). If the print falls below 5.0% YoY, expect copper and silver to extend Friday’s losses as industrial demand fears compound. If above 5.5%, metals bounce.
Wednesday March 18: EIA Weekly Petroleum Report. If Gulf Coast PADD 3 receipts fail to show a massive build, the market will realiz the SPR barrels are delayed, sending Brent back to test $107. A draw would be explosive for prices.
Thursday March 19: Golden Pass Operational Update. If Exxon’s scheduled investor call confirms a first-cargo delay into April, Henry Hub will reprice lower as feed gas backs up. If on schedule, JKM reprices higher on confirmed new supply.
Friday March 20: Baker Hughes Rig Count. If the count breaks above 600, the market will start pricing a structural second-half U.S. supply response.
Action Items:
For Traders:
* Hold Brent longs in the $95 to $105 band. Treat a daily close below $94 as your hard stop.
For Operators:
* Front-load your Gulf Coast maintenance immediately. Every day of downtime you schedule now is a day you avoid competing with SPR barrels for pipeline capacity next month.
For Investors:
* Buy the infrastructure, not the headline.
The Bottom Line
Price shouts panic, positioning quietly bets on the bottleneck.
In case you have missed my previous article about the Death of the Old Model Part 1:
Coming next:
The Death of the Old Model : Part 2.
Silver’s Split Personality: Monetary Metal Meets Industrial Chokepoint.
Copper at the Wall: When Every Grid Needs the Same Ton.
Share this with the person who always asks what actually moved this week and why. That is who Flux Kinetics is written for.
Flux Kinetics - Where Energy Meets Intelligence.
Wassim CHIADLI
This content is for educational purposes only and does not constitute financial, legal, or tax advice. All opinions and analyses are my own, and any actions you take are at your own risk after consulting an appropriate professional.