

The Death of the Old Model. Part 1.
Gold's Secret $5,000 floor.

Your macro model is missing half the global central bank bid.
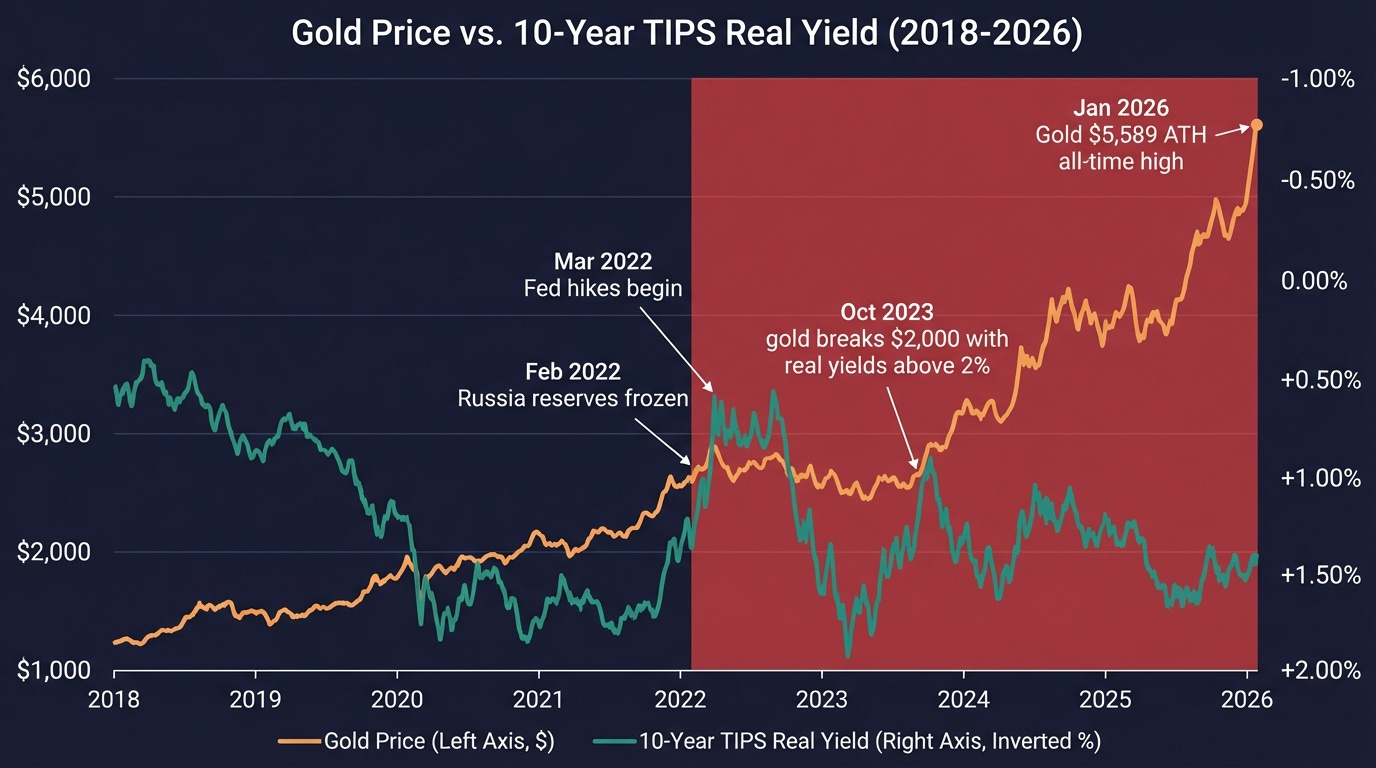
Somewhere on a reserve management desk in Warsaw, a screen shows spot gold at $5,100 an ounce. Three monitors to the right, the 10-year TIPS yield reads 1.80%. Positive. In any textbook written before 2022, those two numbers cannot coexist. Positive real yields mean a real return on sovereign paper. A real return on sovereign paper is supposed to starve gold of oxygen. That is how it worked for four decades.
The prevailing read is familiar. Gold is up on geopolitical anxiety, Fed cut expectations, and a weakening dollar. Safe-haven demand. Macro uncertainty. The same story recycled since 2020, just with bigger numbers attached. Most allocators still model gold as a real-yield trade with a risk premium bolted on top. Strip the premium, they assume, and gold drifts back toward the curve.
Here is what that model misses. Gold gained roughly 66% in 2025, its steepest annual climb since 1979, per the World Gold Council. It printed an all-time high of $5,589 in late January 2026. And it did this while 10-year real yields stayed firmly positive, ranging between 1.5% and 2.2%. The metal set 53 new records last year. The correlation between gold and real rates did not just weaken. It fractured. The reason is not rates. It is a change in who buys. Over the next 12 to 24 months, this buyer shift determines whether gold consolidates above $5,000 or reprices higher still.
What this piece covers
The broken correlation: 2022-2026
The invisible 57%
Custody insurance, not inflation hedge
From bullion to copper: the regime hedge spreads
The Regime vs. Macro Diagnostic
“You cannot freeze gold held in your own vault. That is the entire thesis.”
The Broken Correlation: 2022-2026
The inverse relationship between gold and US real interest rates held reliably for decades. When real yields fell, gold rose. When real yields rose, gold rolled over. The opportunity cost of holding a zero-yield metal was nearly mechanical.
If you want the baseline on how sovereign debt math is forcing this pivot, Ray Dalio laid out the exact blueprint for gold as the #2 reserve currency early last year:
Then the Federal Reserve started hiking in March 2022. Real yields climbed from negative territory to above 2%. Gold should have rolled over. It did not. Apollo chief economist Torsten Slok called it plainly in February 2026: “When the Fed started raising interest rates in 2022, the strong correlation between gold and real rates broke down.” Gold has since gained more than 150% from its pre-hike levels.
Now look at the numbers. The LBMA gold price set 53 all-time highs in 2025 alone. The annual average price hit $3,431 per ounce, up 44% year-on-year. As of early March 2026, 10-year TIPS yields sit around 1.80% according to Trading Economics data. Gold trades near $5,100. The old model says one of these prices is wrong.
The old model is measuring the wrong buyer.
The Invisible 57%
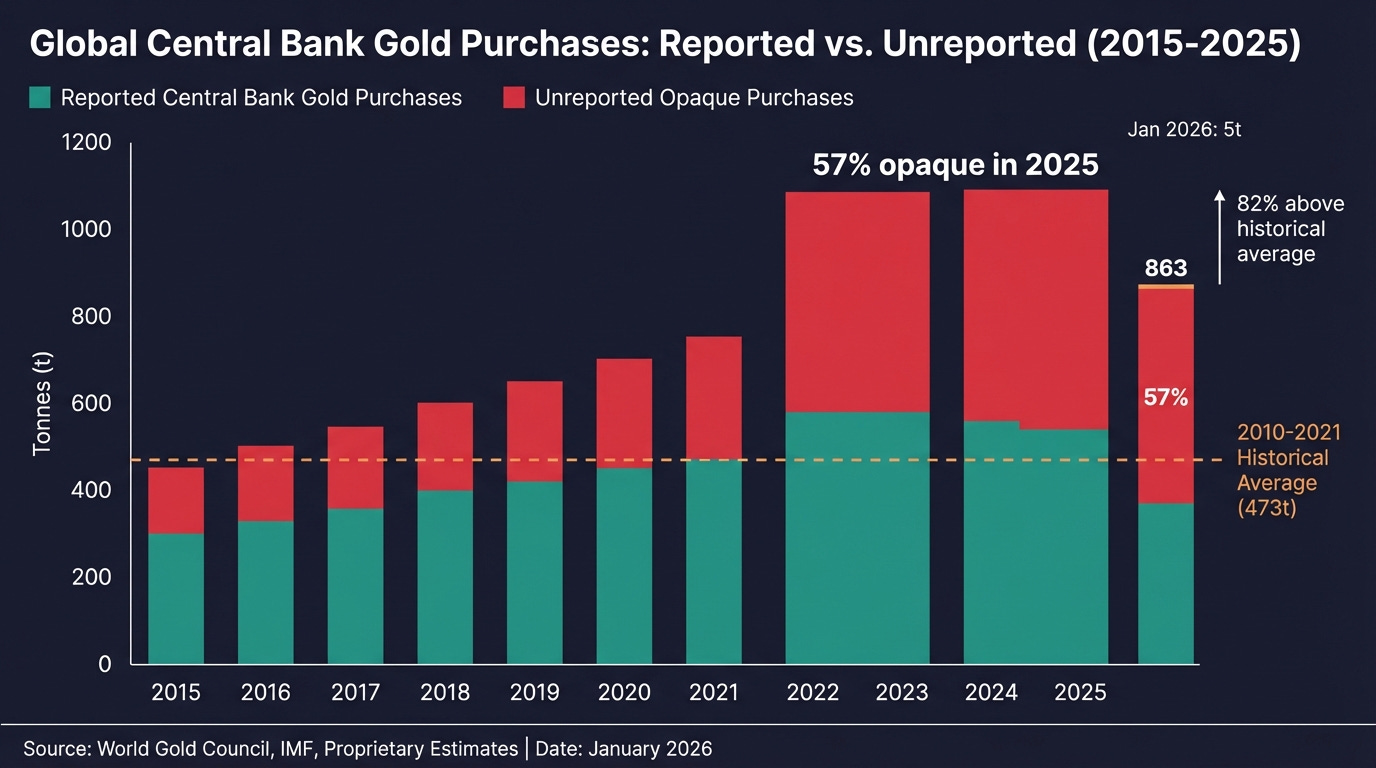
Central banks bought 1,080 tonnes of gold in 2022. Then 1,051 tonnes in 2023. Then 1,092 tonnes in 2024. In 2025, the figure came in at 863 tonnes, per the World Gold Council. That looks like a pullback until you measure it against the 2010-2021 annual average of 473 tonnes. Even the moderation ran 82% above the prior decade’s norm.
But here is the thing. According to Metals Focus estimates, roughly 57% of central bank gold purchases in 2025 were opaque. Unreported. Conducted by institutions that do not disclose to the IMF in real time, or at all. The WGC’s own data showed only 328 tonnes of reported purchases for the full year. The rest is estimated from refinery throughput, trade statistics, and residual analysis.
That single number should reframe how anyone prices this market. More than half of the most durable demand source is invisible to the tape. It does not show up in COMEX positioning. It does not flow through LBMA clearing. It settles bilaterally, government-to-government, and appears in the data only when the analytics firms catch the residual. Every model built on visible flows is systematically underweighting demand by roughly half.
This explains the baffling staircase pattern of 2023-2026. Gold pulls back 5-8% on a dollar spike or a hawkish print. The visible market reads weakness. The invisible market reads a buying opportunity. The floor reasserts. Corrections are sharp, shallow, and short-lived. I have watched this pattern repeat seven or eight times now. It stops being coincidence around the third.
“57% of central bank gold buying in 2025 was unreported. Your model is missing half the bid.”
Custody Insurance, Not Inflation Hedge
Here is the catch. This is not about inflation. US CPI is running around 2.7%. Elevated, but not the kind of monetary crisis that historically sent gold parabolic. And it is not about the dollar index, which has been volatile but structurally intact.
It is about custody.
In February 2022, the G7 coalition froze approximately $300 billion in Russian central bank reserves. The West demonstrated it could immobilize a sovereign’s foreign-held reserves in response to geopolitical conflict. That was the shot heard around every non-aligned reserve desk on earth.
To understand the exact moment the dollar shifted from a neutral reserve to a weapon of war, Saleha Mohsin’s post-mortem is required viewing:
Gold is the only reserve asset a sovereign can mine, refine, transport, and vault on its own territory, outside any foreign counterparty chain. It cannot be frozen by executive order. It cannot be switched off by disconnecting a SWIFT code. It does not require a custodian in Brussels or New York to honor a claim.
In a world where reserves can be weaponized, gold is custody insurance.
The sovereign accumulation dossier (2025 data):
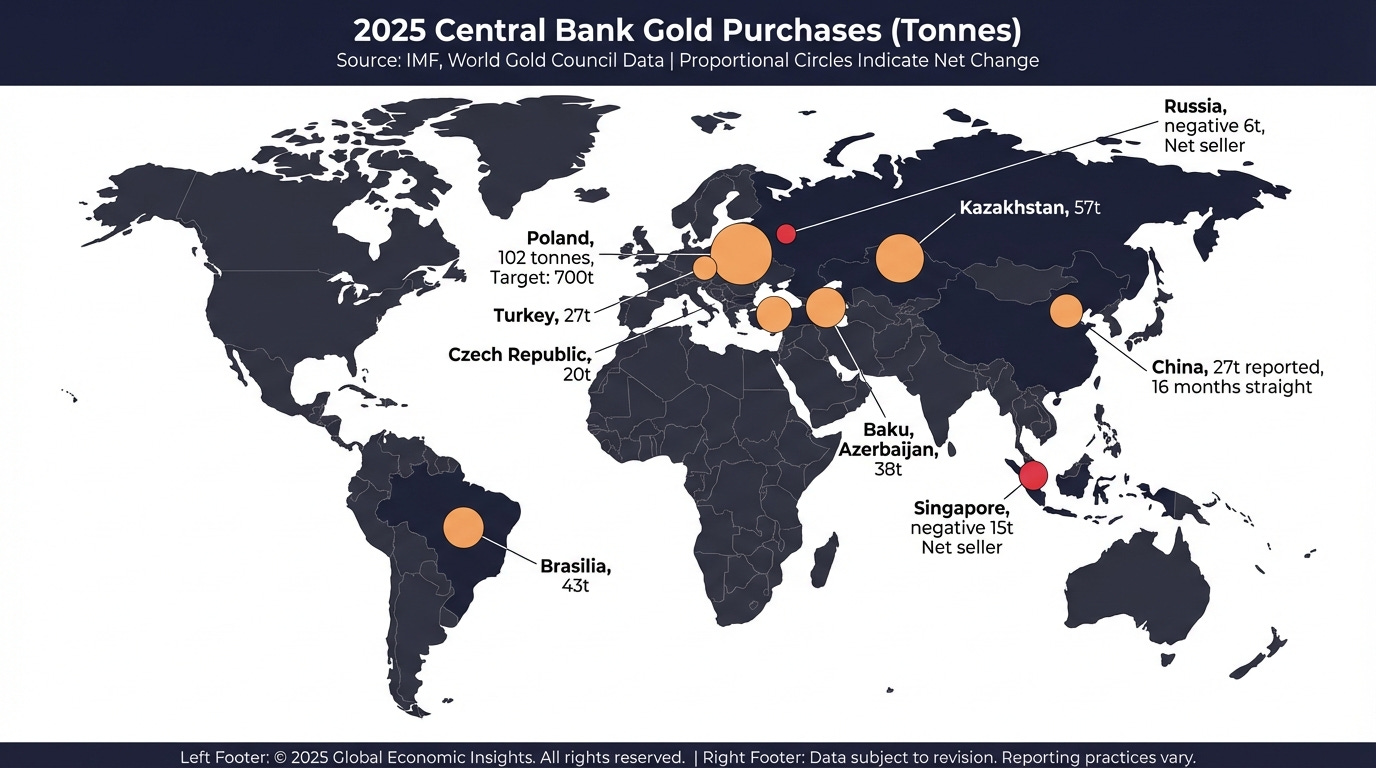
Poland: 102 tonnes acquired. World’s largest sovereign buyer for the second straight year. Accumulation target raised to 700 tonnes by Governor Glapiński. Stated motive: National security.
Kazakhstan: 57 tonnes acquired (record high). Stated motive: Net buying mandated until global tensions ease.
Brazil: 43 tonnes acquired over three months, snapping a four-year absence.
China: 16 consecutive months of buying through February 2026. Official reserves pushed to 74.22 million troy ounces.
These buyers do not sell on price pullbacks. They buy through them. They are not maximising risk adjusted return. They are minimising existential exposure.
From Bullion to Copper: The Regime Hedge Spreads
Gold sits at the front of a longer queue. The same governments treating bullion as a strategic asset are treating copper, uranium, rare earths, and power transformers as strategic hardware. Poland is not just buying gold for national security. It is building defense infrastructure, hardening energy supply chains, and spending at wartime tempo. The PBOC is not just accumulating gold. It is stockpiling industrial metals and securing long-term supply.
This suggests gold is the first asset to get repriced in a regime-hedge cycle because it is the simplest. No supply chain. No processing bottleneck. No technology risk. Just metal in a vault. But the same calculus that drove central banks into bullion is now pulling capital toward industrial metals that sit at physical chokepoints in the energy transition and the defense supply chain.
If gold is the canary, copper is the mine.
The Regime vs. Macro Diagnostic
Strip back the narrative. When gold moves, the question is always the same: macro trade or regime shift?
Run the following rule-set.
1. The Real-Yield Diagnostic
Pull the 10-year TIPS yield weekly from Trading Economics.
IF real yields are rising AND gold is falling -> THEN classic macro is driving. Standard models apply.
IF real yields are rising AND gold is flat or rising -> THEN regime-risk demand is absorbing the macro headwind. Weight exposure toward structural flows.
2. The Structural Floor Diagnostic
Track WGC monthly central bank statistics. January 2026 showed a severe drop to 5 tonnes.
IF the Q1 three-month average recovers above 20 tonnes -> THEN the structural floor is intact.
IF it stays below 10 tonnes through Q2 2026 -> THEN reassess the core thesis entirely.
3. The Opacity Gap Diagnostic
Monitor the spread between Metals Focus total estimates and IMF reported data.
IF the gap widens -> THEN sovereigns are increasing covert accumulation. Bullish.
IF the gap narrows -> THEN transparency is improving or buying is genuinely slowing.
4. The Custody Kill-Switch
IF annual central bank buying falls below 473 tonnes (the 2010-2021 historical average) for two consecutive years -> THEN the structural bid has broken.
Until then, dips in the sovereign class of buyer will be absorbed.
Gold is trading north of $5,100 in early March 2026 with real yields at 1.80%. That is not a macro trade with a geopolitical premium. It is a verdict on the monetary architecture. The textbook relationship between gold and real yields assumed all sovereign reserves were safe in foreign custody. That assumption died in February 2022 in the Euroclear vaults in Brussels.
You are now someone who reads gold not as a chart, but as a custody ledger.
In case you’ve missed my previous article about LNG (Liquefied natural gas):

Coming next:
Part 2.
Silver’s Split Personality: Monetary Metal Meets Industrial Chokepoint
Copper at the Wall: When Every Grid Needs the Same Ton
Share this with the colleague who still thinks gold is an inflation trade and bring them into the conversation. That is who Flux Kinetics is written for.
Flux Kinetics - Where Energy Meets Intelligence.
Wassim CHIADLI
This content is for educational purposes only and does not constitute financial, legal, or tax advice. All opinions and analyses are my own, and any actions you take are at your own risk after consulting an appropriate professional.
Thank you both for the Restack @AlgoTradeAlert.com, @Elvira. Part 2 will be finalised soon.