

The Tank Finally Turned.

For seven weeks the tank filled. This week it drained, and the only people surprised were the ones reading paper prices.
A funny thing happens when every trader on the planet is staring at the same chart. The majority misses the pipe behind it. On Tuesday, the IEA did something it has not done since lockdowns. It told the world that 2026 will be a year of shrinking oil demand. On Wednesday, the EIA told the world that U.S. crude stocks fell for the first time in almost two months. Put those two sentences next to each other and they should cancel out. Less demand, smaller tanks. One of those is wrong.
Neither is wrong. That is the interesting part.
📬 Never miss a signal
If this is your first time reading Flux Kinetics, every weekly note lands free in your inbox. No noise, no filler, just what actually moved the tape.
This Week’s Settle:
The IEA cut its 2026 demand forecast by 810,000 barrels per day in a single revision. That is the largest one-month cut the agency has printed outside of 2020, and it flips the year from plus 730,000 bpd of growth to minus 80,000 bpd of contraction. Jet fuel in Asia is softer. Gasoline in Europe is softer. Industrial diesel in China is the softest of all. Whatever the mix, the direction is one way.
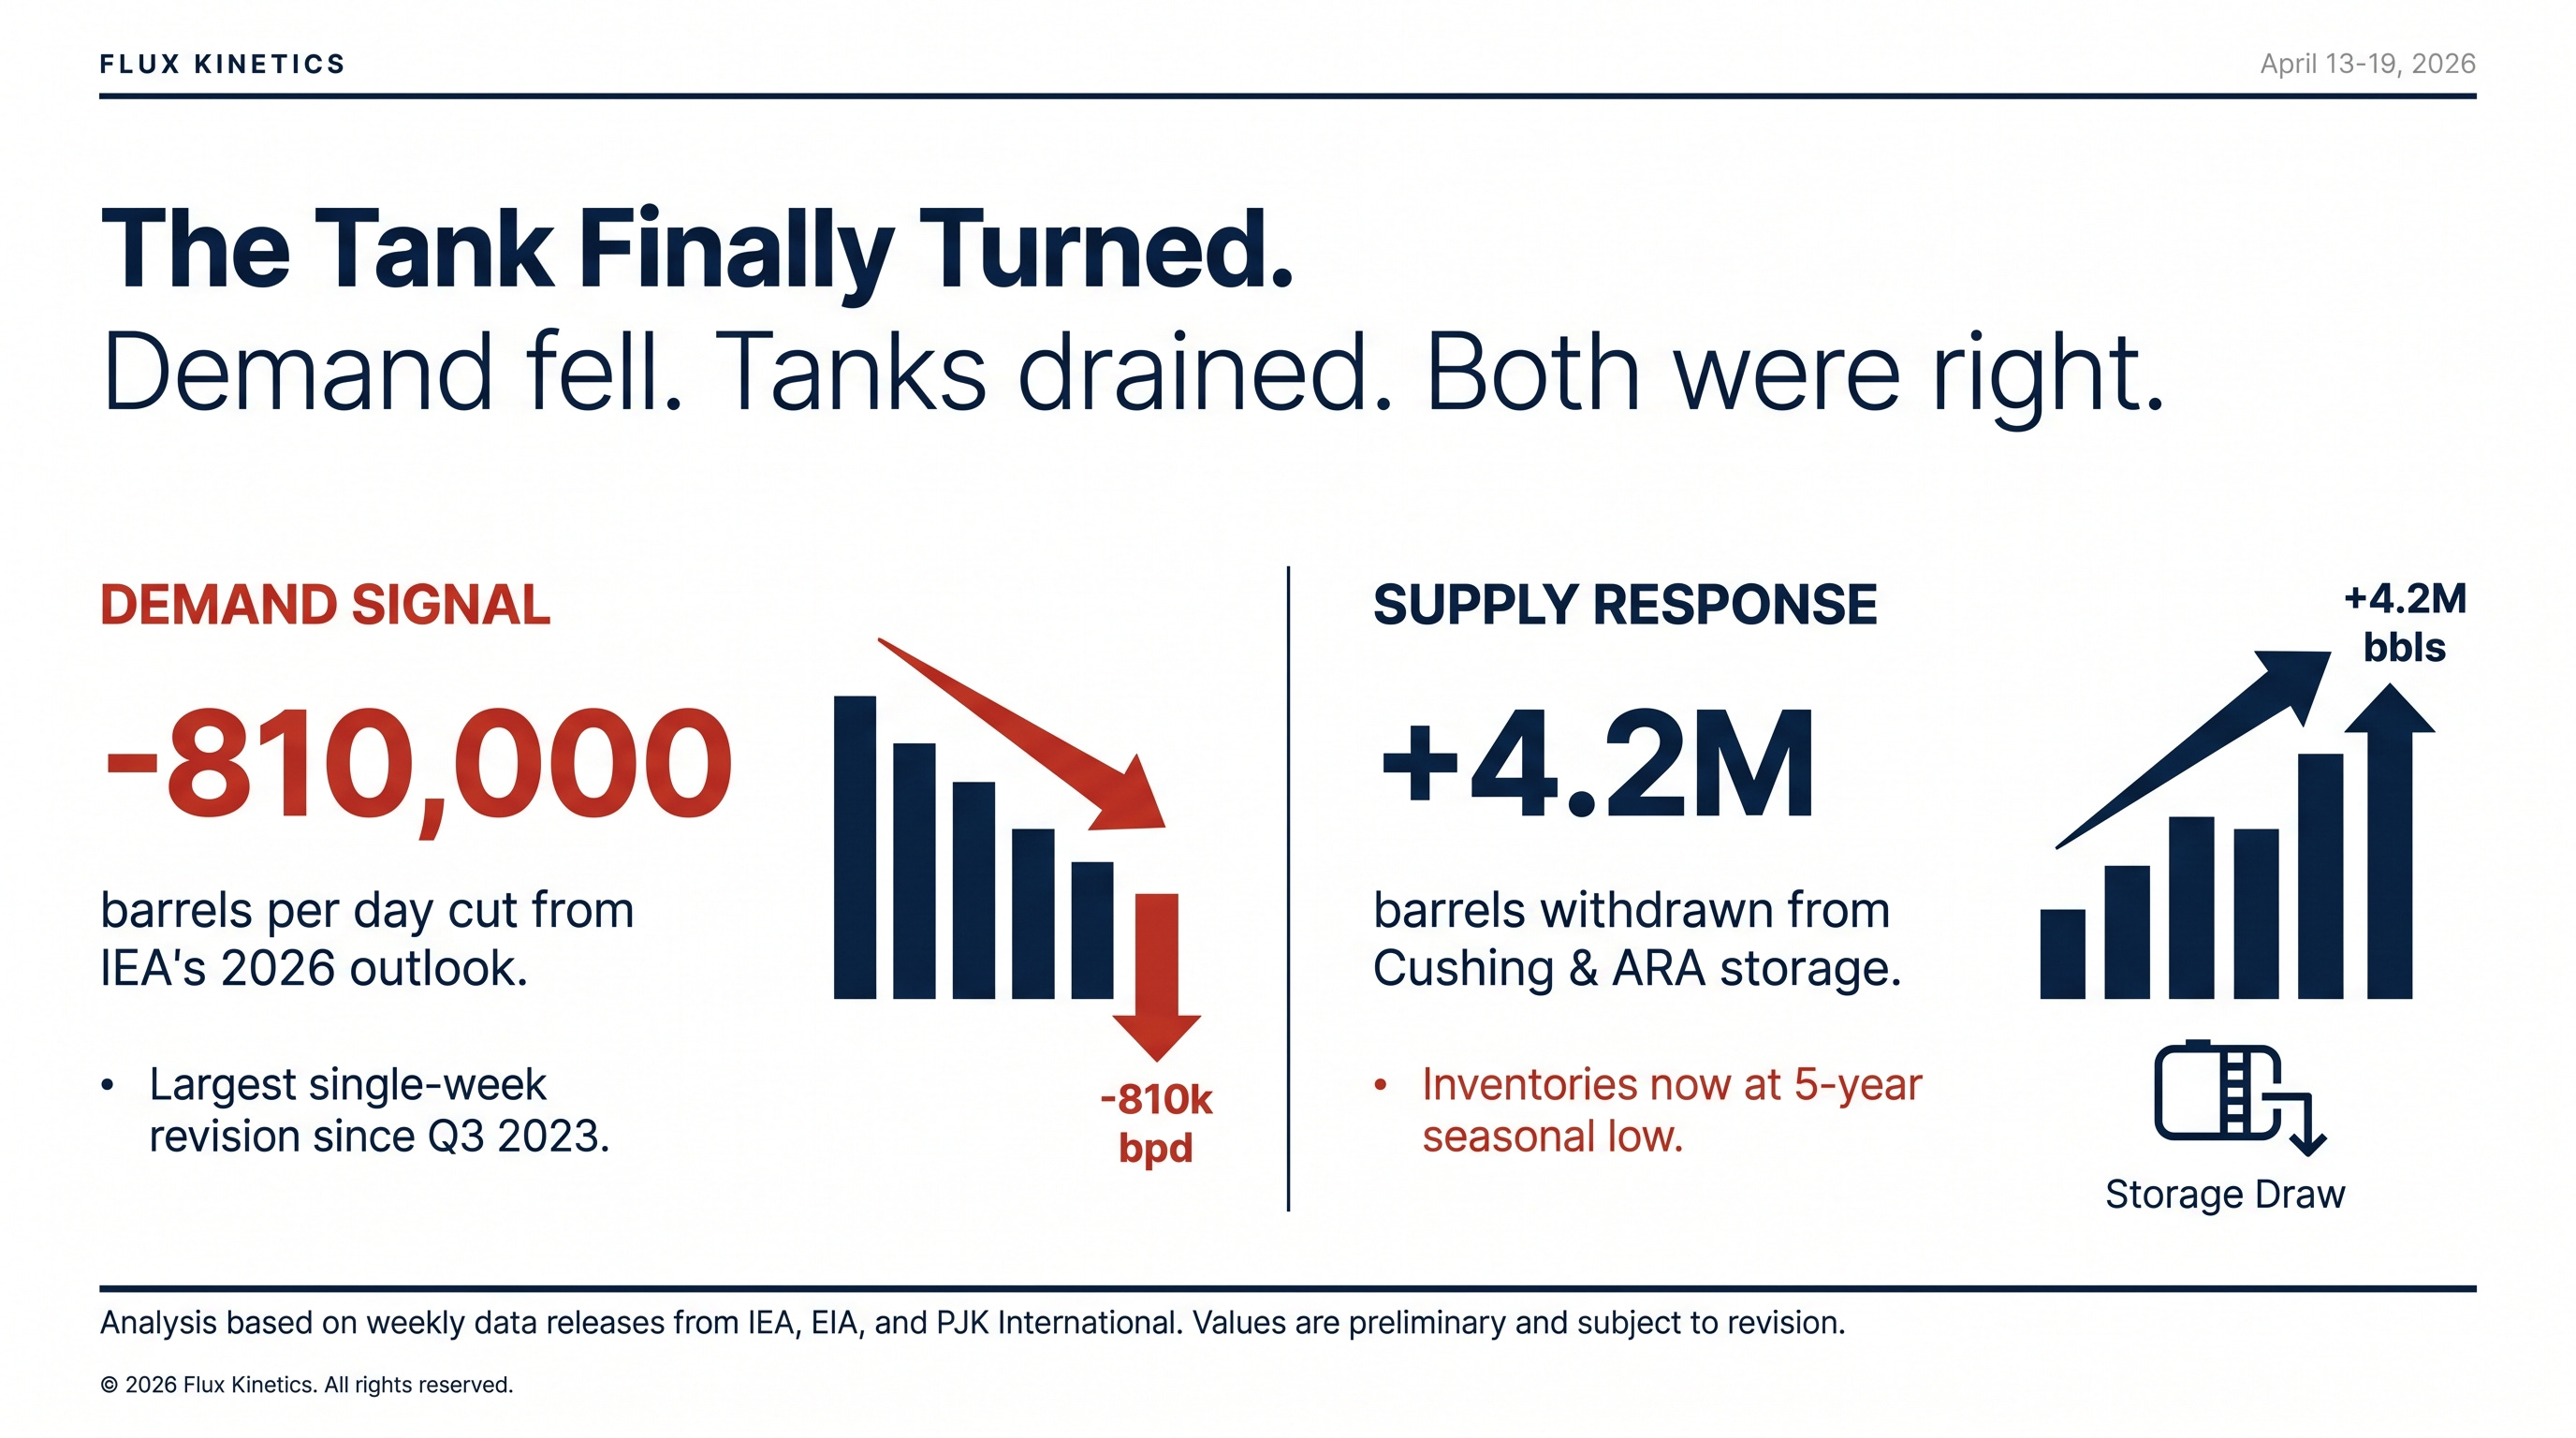
Then the EIA print landed. Commercial crude stocks fell 913,000 barrels to 463.8 million, against a consensus build of 200,000. Gasoline drew 6.3 million. Distillates drew 3.1 million and are still sitting below the five-year average. The draw was not about Americans suddenly burning more fuel. It was about barrels leaving the country. Exports jumped. Gulf Coast terminals loaded at full tilt. The oil did not disappear, it got on a boat.
In simple terms: the world is asking for less oil overall, but the specific oil sitting in Cushing is finally moving to the buyers who actually want it. That distinction is the whole story this week.
Oil: Brent closed Friday at $90.38, down roughly 5% on the week. WTI settled at $82.59. U.S. crude inventories drew 913,000 barrels, breaking a seven-week build streak.
Natural Gas: Henry Hub May futures printed $2.67 at Friday’s close, still pinned below $3. Working gas in storage reached 1,970 Bcf on April 10, now 126 Bcf above the same week last year.
Gold: Ended near $4,879 per ounce after tagging $4,913 intraday Friday. The metal held $4,800 on three separate retests.
Silver: Settled around $81.84 after a 5.7% single-session rip midweek. J.P. Morgan lifted its 2026 average forecast to $81.
Lithium: Battery-grade carbonate spot in China reached $24,086 per metric ton on SMM data, roughly double the December low.
These numbers set gasoline at the pump, electricity bills, the cost of every solar module leaving Chinese ports, and the price of every cell going into an EV this summer.
The Insider View:
Now the curve, because this is where the real confession lives. Brent prompt-to-deferred backwardation compressed from $22 at the peak to about $8 by Friday’s close. That is not normalisation, that is capitulation. Traders who were pricing an acute shortage three weeks ago are now pricing a second-half surplus. The speed of that shift is what makes me cautious. Markets that re price this fast usually overshoot in both directions, and the next leg is not obvious.
The refiners are the quiet tell. U.S. 3-2-1 crack spreads stayed above $40 even as crude dropped, which is why Gulf Coast utilisation climbed past 90%. Europe is the photo negative. Northwest European hydro skimming margins turned negative the week of April 6, averaging minus $6.45 per barrel on IEA numbers. Houston is running hot on discounted feedstock. Rotterdam is losing money on every barrel it cracks. That split will be loud in the Q1 earnings calls starting next week, and it is going to dictate how the second quarter gets priced. Keep an eye on Valero, Marathon Petroleum, and Phillips 66. Keep the other eye on TotalEnergies’ refining segment, which is where the pain will surface first on the European side.
Watch: Refinery for Beginners - How Does a Refinery Work?
Silver’s Two Masters:
Last week I flagged silver as the metal that cannot serve two masters. This week the market made the case for me, then ignored it.
On Wednesday silver ripped 5.7% in a single session and pushed above $79. Gold barely moved on the same day. That almost never happens. Silver usually leans on gold the way a younger sibling leans on the older one. This time it walked off on its own.
In case you’ve missed my previous article about The Silver Bottleneck:

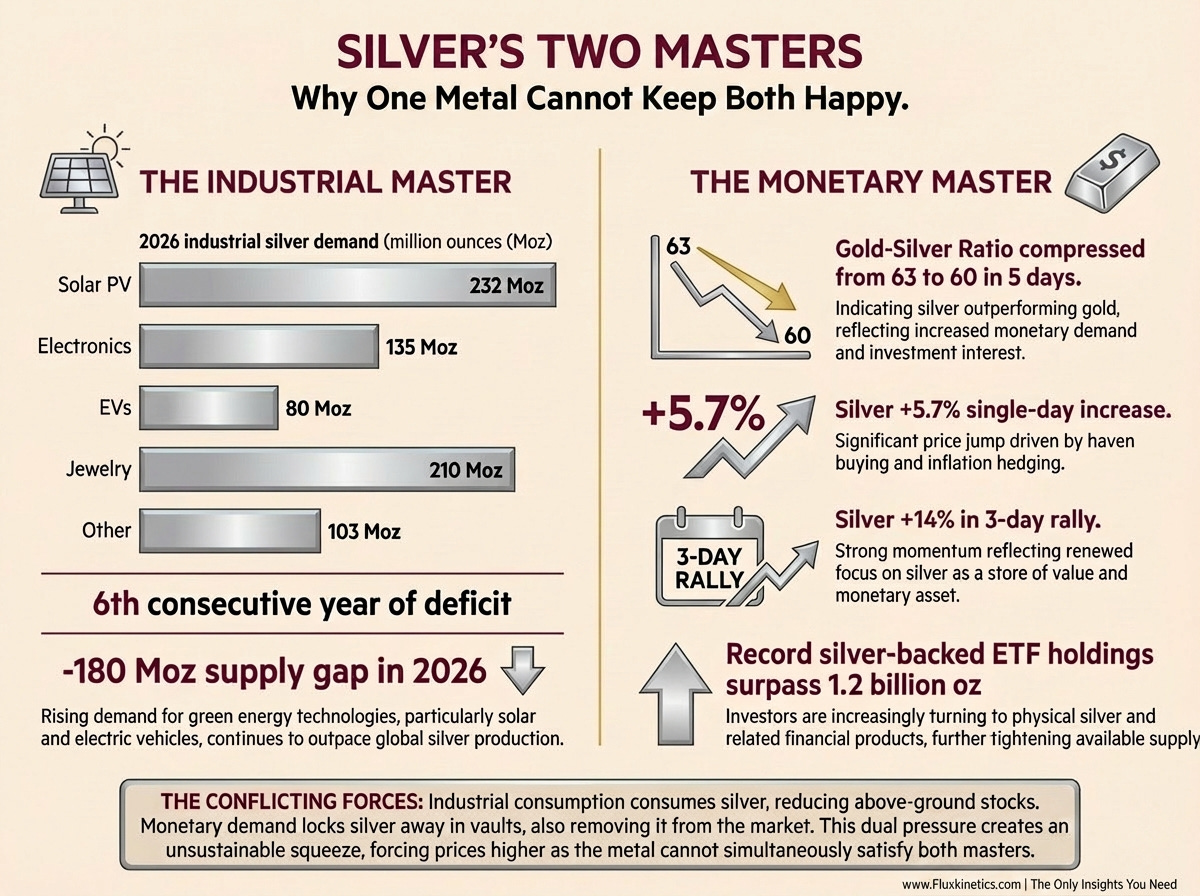
The driver is not monetary. It is industrial, and the supply side is broken. The Silver Institute is now flagging a sixth consecutive annual deficit, with total demand outrunning mine supply by roughly 180 million ounces in 2026. Photovoltaic fabrication alone is on track to absorb 232 million ounces, up from 193 million two years ago. Every gigawatt of new solar capacity installed needs around 10 tonnes of silver paste. China added 277 GW last year. India is aiming for 50 GW this year. The U.S. Inflation Reduction Act pipeline adds another 40 GW. The arithmetic does not close, and it has not closed for six years running.
The supply side is the part nobody discusses at dinner parties. Roughly 70% of mined silver comes as a by-product of copper, zinc, and lead operations. That means silver supply is hostage to copper and zinc capex decisions, which are not getting made fast enough. Fresnillo in Mexico is guiding production lower this year. Pan American Silver has issues at La Colorada. Hochschild is running flat. Primary silver miners are a rounding error in global output, which is why the market cannot simply drill its way out.
So what happens when a metal with a structural deficit also gets a monetary bid? You get what we saw this week. The gold-silver ratio compressed from 63 to 60 in five trading days, the sharpest weekly move in over a year. Silver is no longer gold’s smaller cousin. It is a supply-constrained industrial metal with a precious-metal option bolted on top. When both masters pull the same way, the move is violent. This week they pulled together, and $80 stopped being a ceiling.
Watch: Inside the Silver Squeeze: Why the Metal the World Forgot Suddenly Took Off
Lithium deserves one more line because the pattern rhymes. Carbonate prices have nearly doubled from the December low. Chinese converters are running tight on feedstock. The Australian spodumene bid is back for the first time in two years. This is not sentiment, it is inventory, and it matters for every battery cell quoted after May.
🔁 Found this useful?
Flux Kinetics runs on word of mouth. If this note sharpened how you see the week, one forward to the right person is worth more than any algorithm.
🛠 My Flux Kinetic Trade:
Those who tracked my last week’s trade are already sitting on a 5% gain in gold. I exited my position on Wednesday at $4,860 and have stayed on the sidelines since.
Target 2 at $4,932 remains untouched, so the waiting game continues into next week.
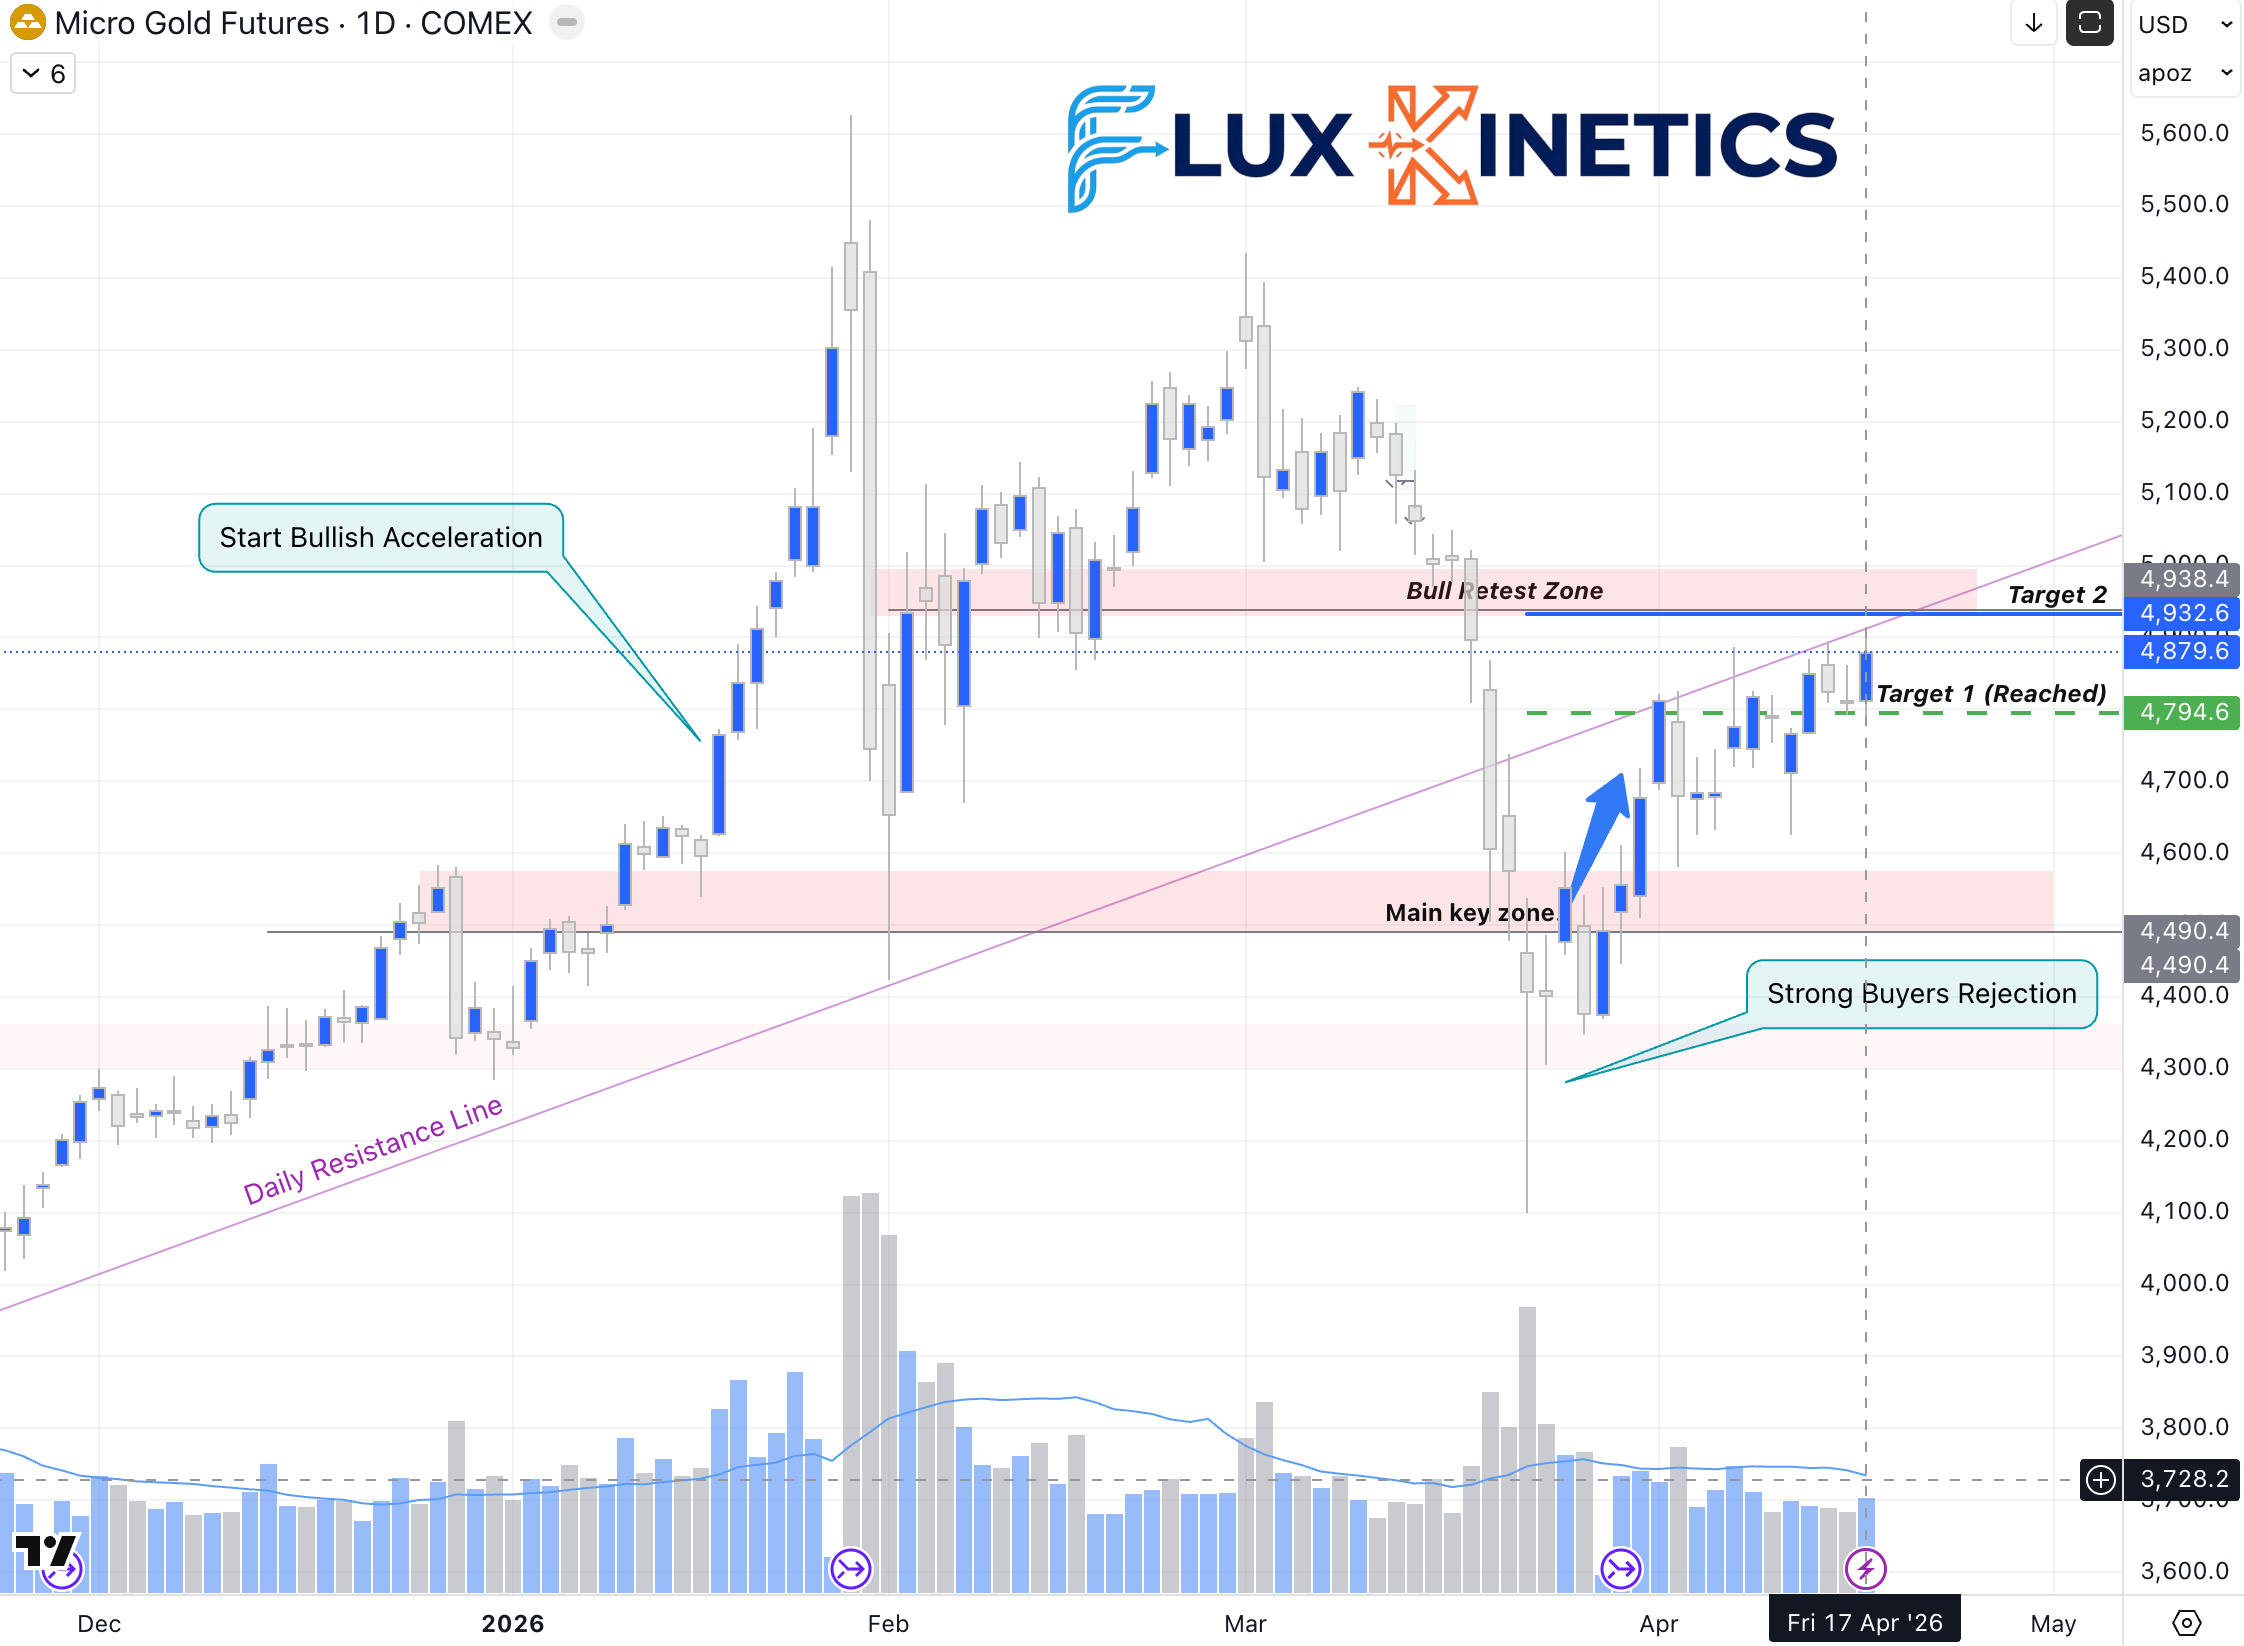
For those holding a position, keep a close eye on the $4,900 resistance level. Don’t get greedy waiting for Target 2 to fully play out… start trimming your exposure and securing some of those gains now.
Also worth remembering: this market can turn on a single headline. Volatility is still very much in play.
If you’re sitting out, patience is your edge. Watch how price behaves around Target 2. A retracement back toward $4,700 could set up a clean entry point.
What to watch next week:
April 23: OPEC Monthly Oil Market Report. Compare their demand line to the IEA’s. The divergence matters more than either number in isolation.
April 24: First of the integrated major Q1 prints. Refining segment commentary is the real signal. Everything above that line is already in the screen.
The Investor’s Perspective:
The three-week gap between paper prices and physical barrels closed this week, and it closed in the direction almost nobody was positioned for. Demand is softening. Tanks are starting to drain. Both of those are bearish flat price and both are bullish for the refiners sitting on the right side of the crack. That is an unusual setup, and it rewards precision.
For equity exposure, the trade map has rotated. U.S. refiners with complex coking capacity are winning on the crack spread. European simple refiners are bleeding. Midstream operators with locked LNG off take are insulated from the flat price entirely. The upstream names that ran hardest on the supply scare three weeks ago are now the most exposed to mean reversion. Quality of asset base matters again, and it will matter more each week the curve keeps flattening.
For those watching energy markets from further out, the takeaway is simple. Demand is not infinite, inventories do not build forever, and silver does not always follow gold. This week all three of those rules reasserted themselves at the same time, which is rare enough to write down.
⚡ One last thing
If this changed how you see the week, send it to one person who needs to see it too. That is how Flux Kinetics grows. Reader by reader, not algorithm by algorithm.
.Coming next:
The Gold To Silver Ratio As A Stress Gauge For The Energy Transition
The Real Economics Behind Small Modular Reactors (SMR)
Flux Kinetics - Where Energy Meets Intelligence.
Wassim CHIADLI
This content is for educational purposes only and does not constitute financial, legal, or tax advice. All opinions and analyses are my own, and any actions you take are at your own risk after consulting an appropriate professional.
Demand is down, inventories are down ... but the oil didn’t disappear, It makes you wonder how often we think we understand what’s happening when we’re really just looking at the surface.