

Triple Digits But The Back End Said No.
Infrastructure damage meets surplus math.

On Thursday I watched WTI touch $100 intraday. It settled at $98. Brent closed at $112, highest since July 2022. And the December 2027 WTI strip? It settled at $69.
That is a $28 gap. The front month is screaming for barrels. The back of the curve is sitting there calmly, pricing a world where all of this gets fixed. One of them is wrong.
The consensus walking in was straightforward. Supply panic accelerates, the SPR is a joke, every dip gets bought. That held for about two days. Then Iraq declared force majeure on Friday. Basra output dropped from 3.3 million barrels per day to 900,000. Brent still could not hold above $113 on the close. When a headline that ugly fails to print a new weekly high, the tape is telling you someone large is selling every rip.
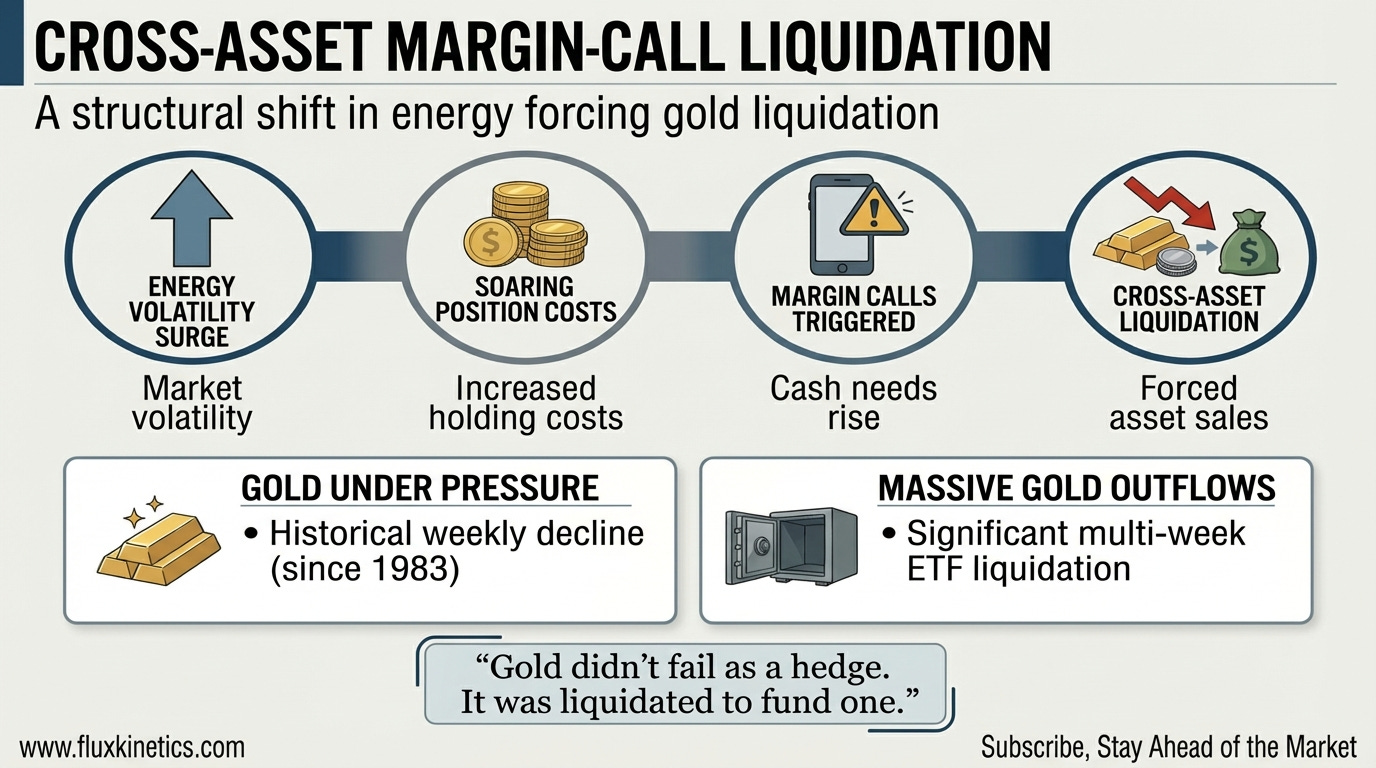
Here is what almost everyone missed. Gold had its worst week since 1983. Down over 10%. At the same time oil was surging to multi-year highs. That is not risk-off. That is a margin call. US gold-backed ETF holdings dropped 30 tonnes in a single week. The energy complex got so expensive to hold that it started pulling cash out of everything else. Gold is liquid. Gold got sold.
Watch how the global economy is under pressure as energy prices surge amid ongoing conflict in the Middle East :
“The front of the curve screams shortage. The back prices a surplus. One of them is wrong.”
This Week’s Settle
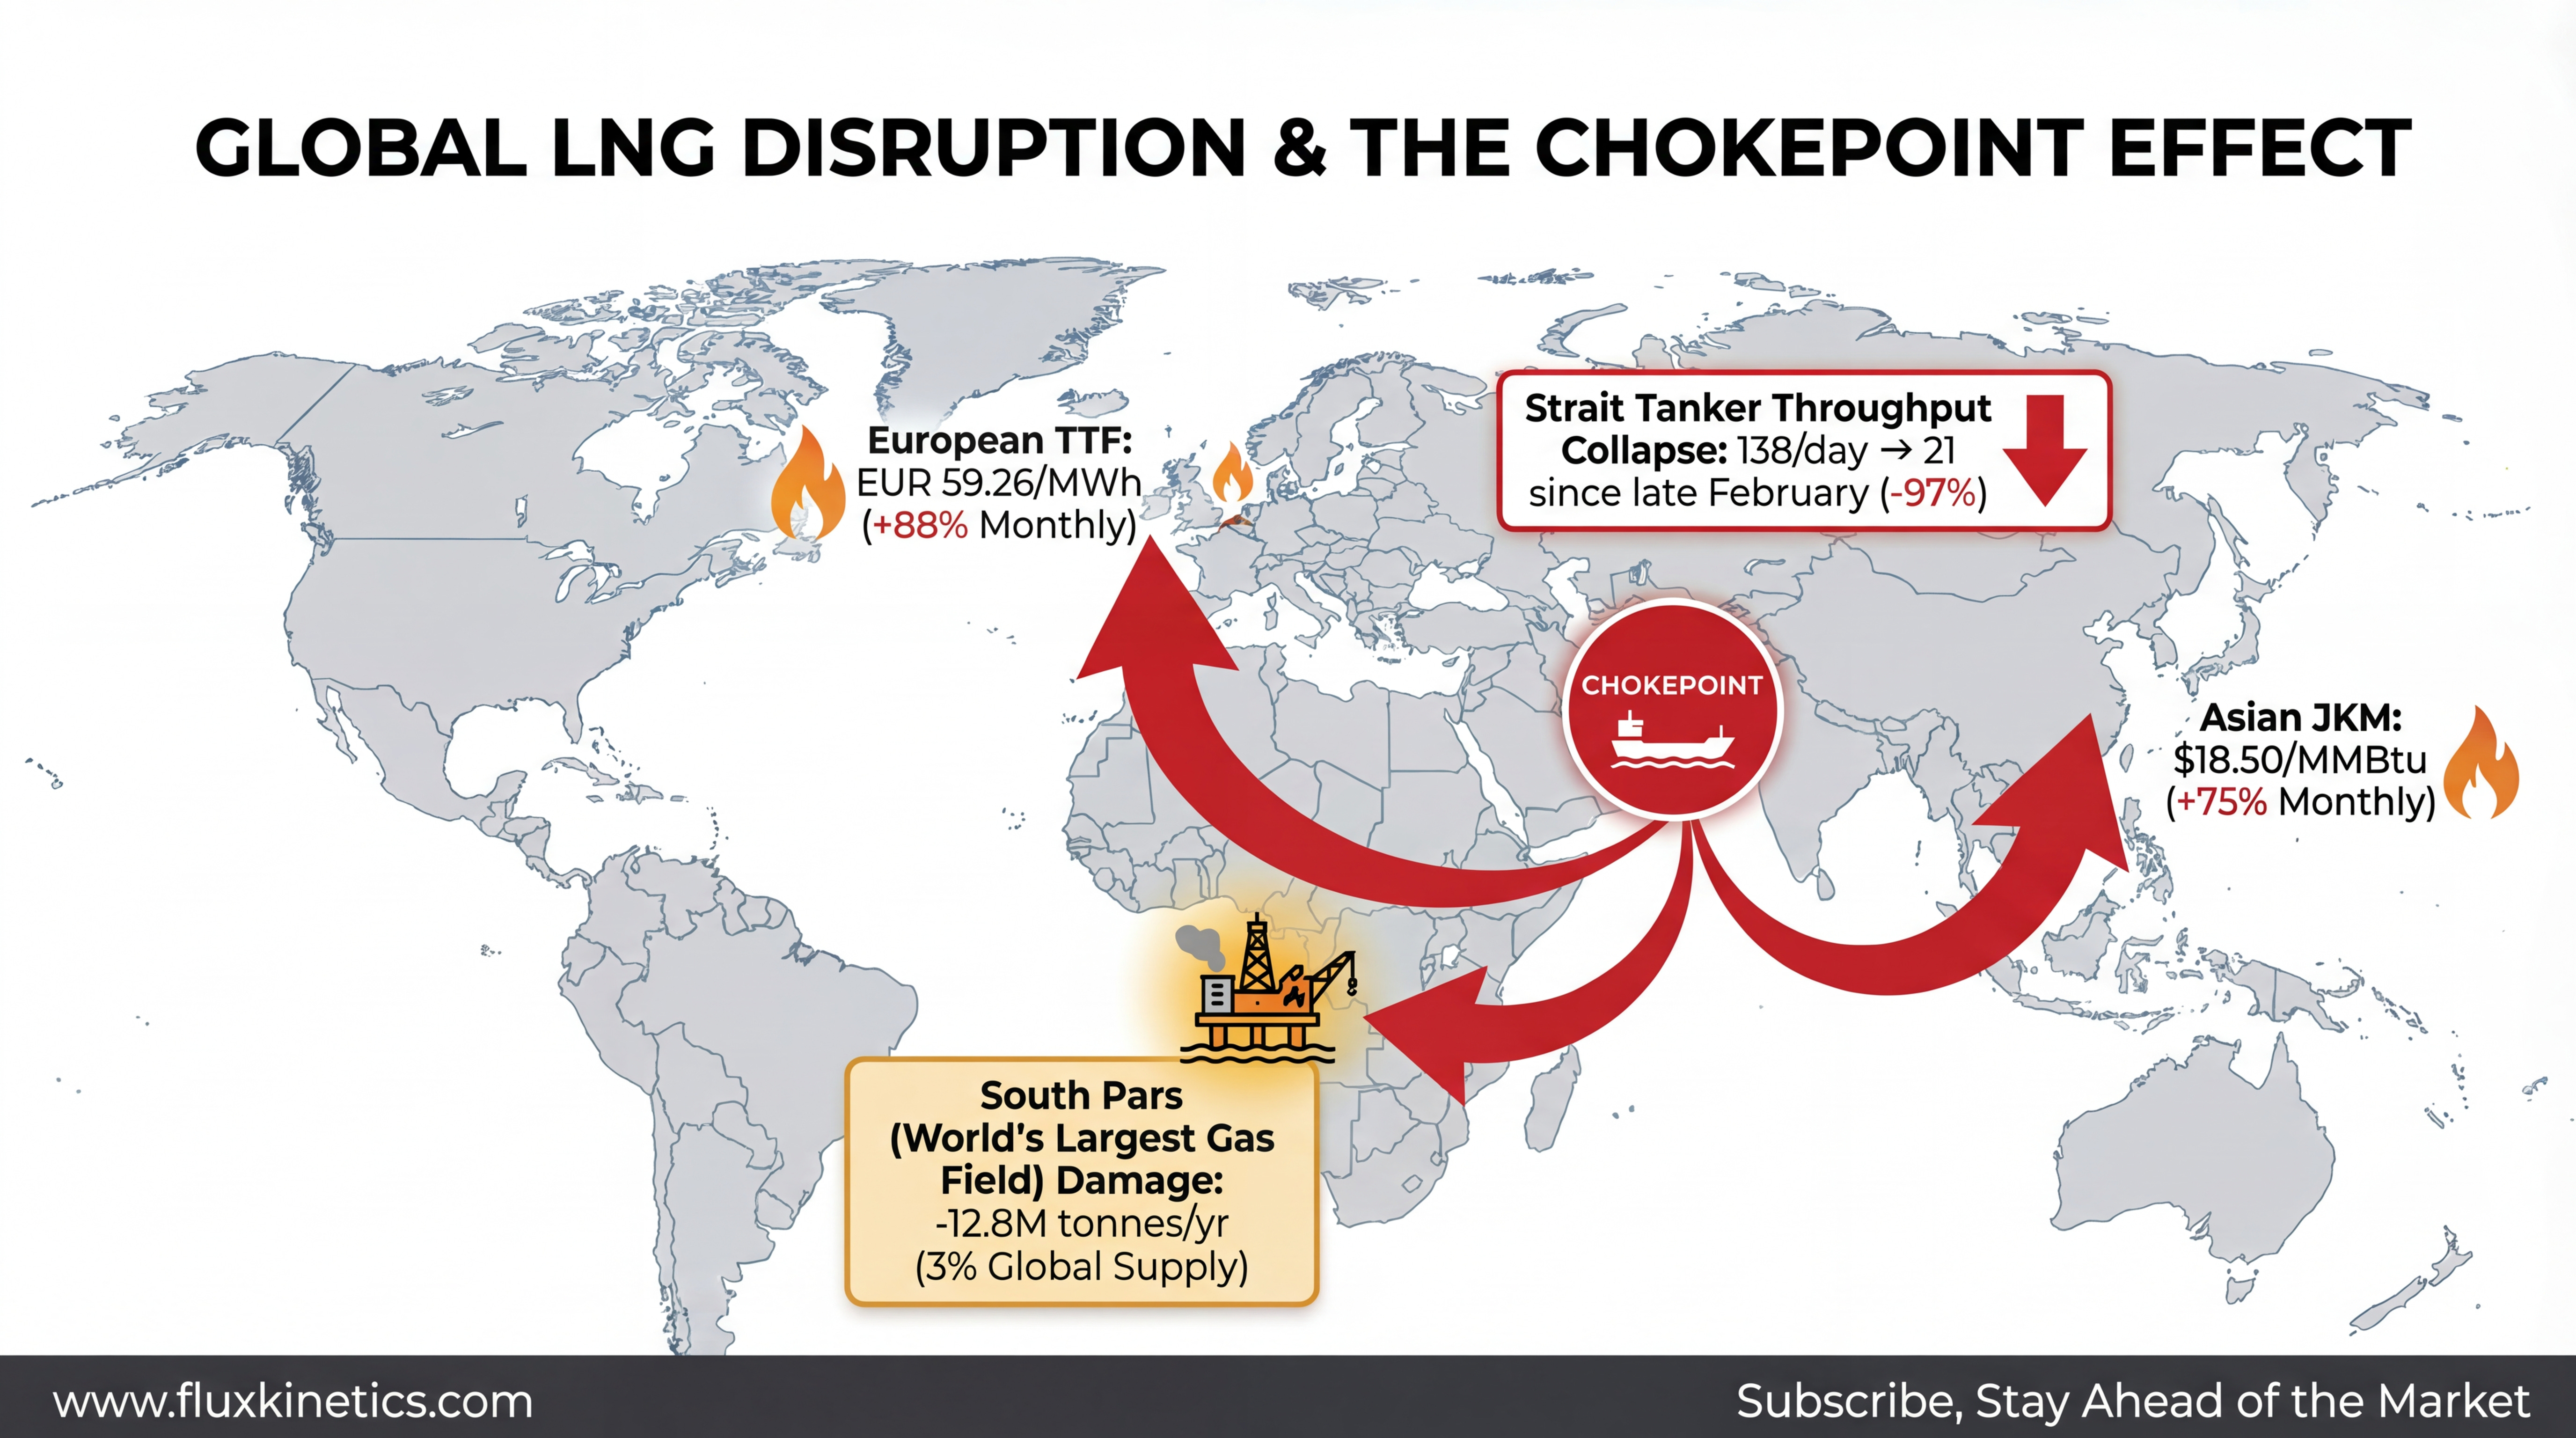
Oil: Brent settled sharply higher at $112.19/bbl (+8% weekly, +56% monthly). The Strait remains functionally closed. Only 21 tanker transits since late February versus 138 per day before. WTI closed at $98.23/bbl (+3% weekly, +48% monthly).
Gas: Henry Hub settled at $3.10/MMBtu (-2% Friday). Totally insulated from the global gas crisis. Permian associated gas keeps the domestic grid comfortable. Meanwhile European TTF jumped to EUR 59.26/MWh (+88% monthly).
Gold: Settled at $4,489/oz (-3% Friday, -14% monthly). Worst weekly decline since 1983.
Silver: Fell to $67.60/oz (-7% Friday, -23% monthly).Gold-to-silver ratio compressed toward 66:1.
Lithium: China battery-grade lithium carbonate at CNY 149,000/tonne ($20,400 USD, -2% Friday). Pulling back from the CNY 175,000 high.
Brief Contents
The Oil and Curve Story
The LNG and Infrastructure Story
The Metals and Margin-Call Story
My Flux Kinetics Conviction
Chokepoints and Capital Flows
Week Ahead: What to Watch
Action Items
THE OIL AND CURVE STORY
The supply disruption stopped being a headline this week. It became an inventory problem.
The EIA data for the week ending March 13 showed US commercial crude inventories up 6.2 million barrels to 449.3 million. About 1% below the five-year average. Refinery runs climbed to 16.2 million barrels per day at 91.4% utilisation. Crude imports jumped 772,000 barrels per day week over week. Rerouted cargoes are making it to the Gulf Coast. They are taking the long way around, but they are arriving.
The US is drowning in domestic supply while the rest of the world fights over barrels.
Now look at the curve. WTI April at $96.19. May at $95.37. June at $91.74. December 2027 at $69.65. Brent is even steeper. May at $103.55, June at $99.55, December 2027 at $74.72. That is textbook backwardation. The market needs crude now, not later, so nearby barrels trade at a big premium to future ones. But the back end is quietly pricing a world where spare capacity returns and non-OPEC supply from Guyana, Brazil, and the Permian covers the gap.
The Brent-WTI spread at $14 is the widest since 2022. It tells you exactly how much the seaborne market is straining while US landlocked crude sits comfortable behind pipeline walls.
Iraq’s force majeure on Friday was the week’s sharpest signal. Basra went from 3.3 million barrels per day to 900,000. Saudi output is down to 8 million bpd from 10.1 million in February after shuttering the Safaniya and Zuluf offshore fields. Net effect: 4 to 5 million barrels per day off the global market.
The Number: 6.2 million barrels. That is this week’s EIA build. It landed while the narrative says barrels are disappearing. They are disappearing from the Gulf. If you trade the disruption headline without checking where the barrels actually sit, you feed the pros.
Does high energy prices could trigger a global recession ?
THE LNG AND INFRASTRUCTURE STORY
Wednesday changed the global gas market for years with the South Pars gas field damage, the world’s largest natural gas reservoir. It takes out 12.8 million tonnes per year of liquefaction capacity for three to five years. Roughly 3% of global supply, gone.
European TTF surged to EUR 59.26/MWh. Up 88% month-over-month. Asian JKM pushed toward $26/MMBtu.
A third of global fertiliser trade moves through the Strait. Urea prices are up 30 to 40%. Fertiliser plants across Asia are shutting for lack of feedstock. If you model the LNG disruption without the ammonia disruption, you are underestimating the shock.
Meanwhile Golden Pass LNG on the US Gulf Coast is weeks from first cargo. Every cargo it produces in Q2 prices at massive premiums. The Asian arbitrage is printing $5-per-MMBtu-plus net backs.
The Insider View: Equities priced the future. Physical just lost the present. Golden Pass, starting up during a supply crisis, now carries a premium that did not exist three days ago.
THE METALS AND MARGIN-CALL STORY
Gold dropped to $4,489. Down 14% over the past month. Worst weekly decline since 1983. ETF holdings shed 30 tonnes. Third straight week of outflows. Over 60 tonnes liquidated across three weeks. All of this happened while every safe-haven trigger in the world was flashing.
The explanation is simple. It is mechanical. The energy complex got so expensive to carry that traders had to sell something else to meet margin. Oil implied volatility hit levels we have not seen since 2020. When your crude position suddenly needs double the margin it did a month ago, you sell what you can. Gold is deep, liquid, and it trades around the clock.
Gold did not fail as a hedge. It was liquidated to fund one.
Silver fell to $67,60 but it held better than gold because solar panel demand and electronics gave it a floor. The gold-to-silver ratio compressed toward 66:1. Silver’s split personality, part precious metal, part industrial input, protected it on the downside.
Lithium pulled back at $20,400 a tonne the price assumes almost zero EV growth. But the physical market is tightening around grid-storage orders. That is the asymmetry.
“Gold didn’t fail as a hedge. It was liquidated to fund one.”
MY FLUX KINETICS CONVICTION
The current situation is changing constantly. A tweet, a headline, a breaking news shift the whole market. This is not the moment to be brave. This is the moment to be smart. Protect your money first. Always.
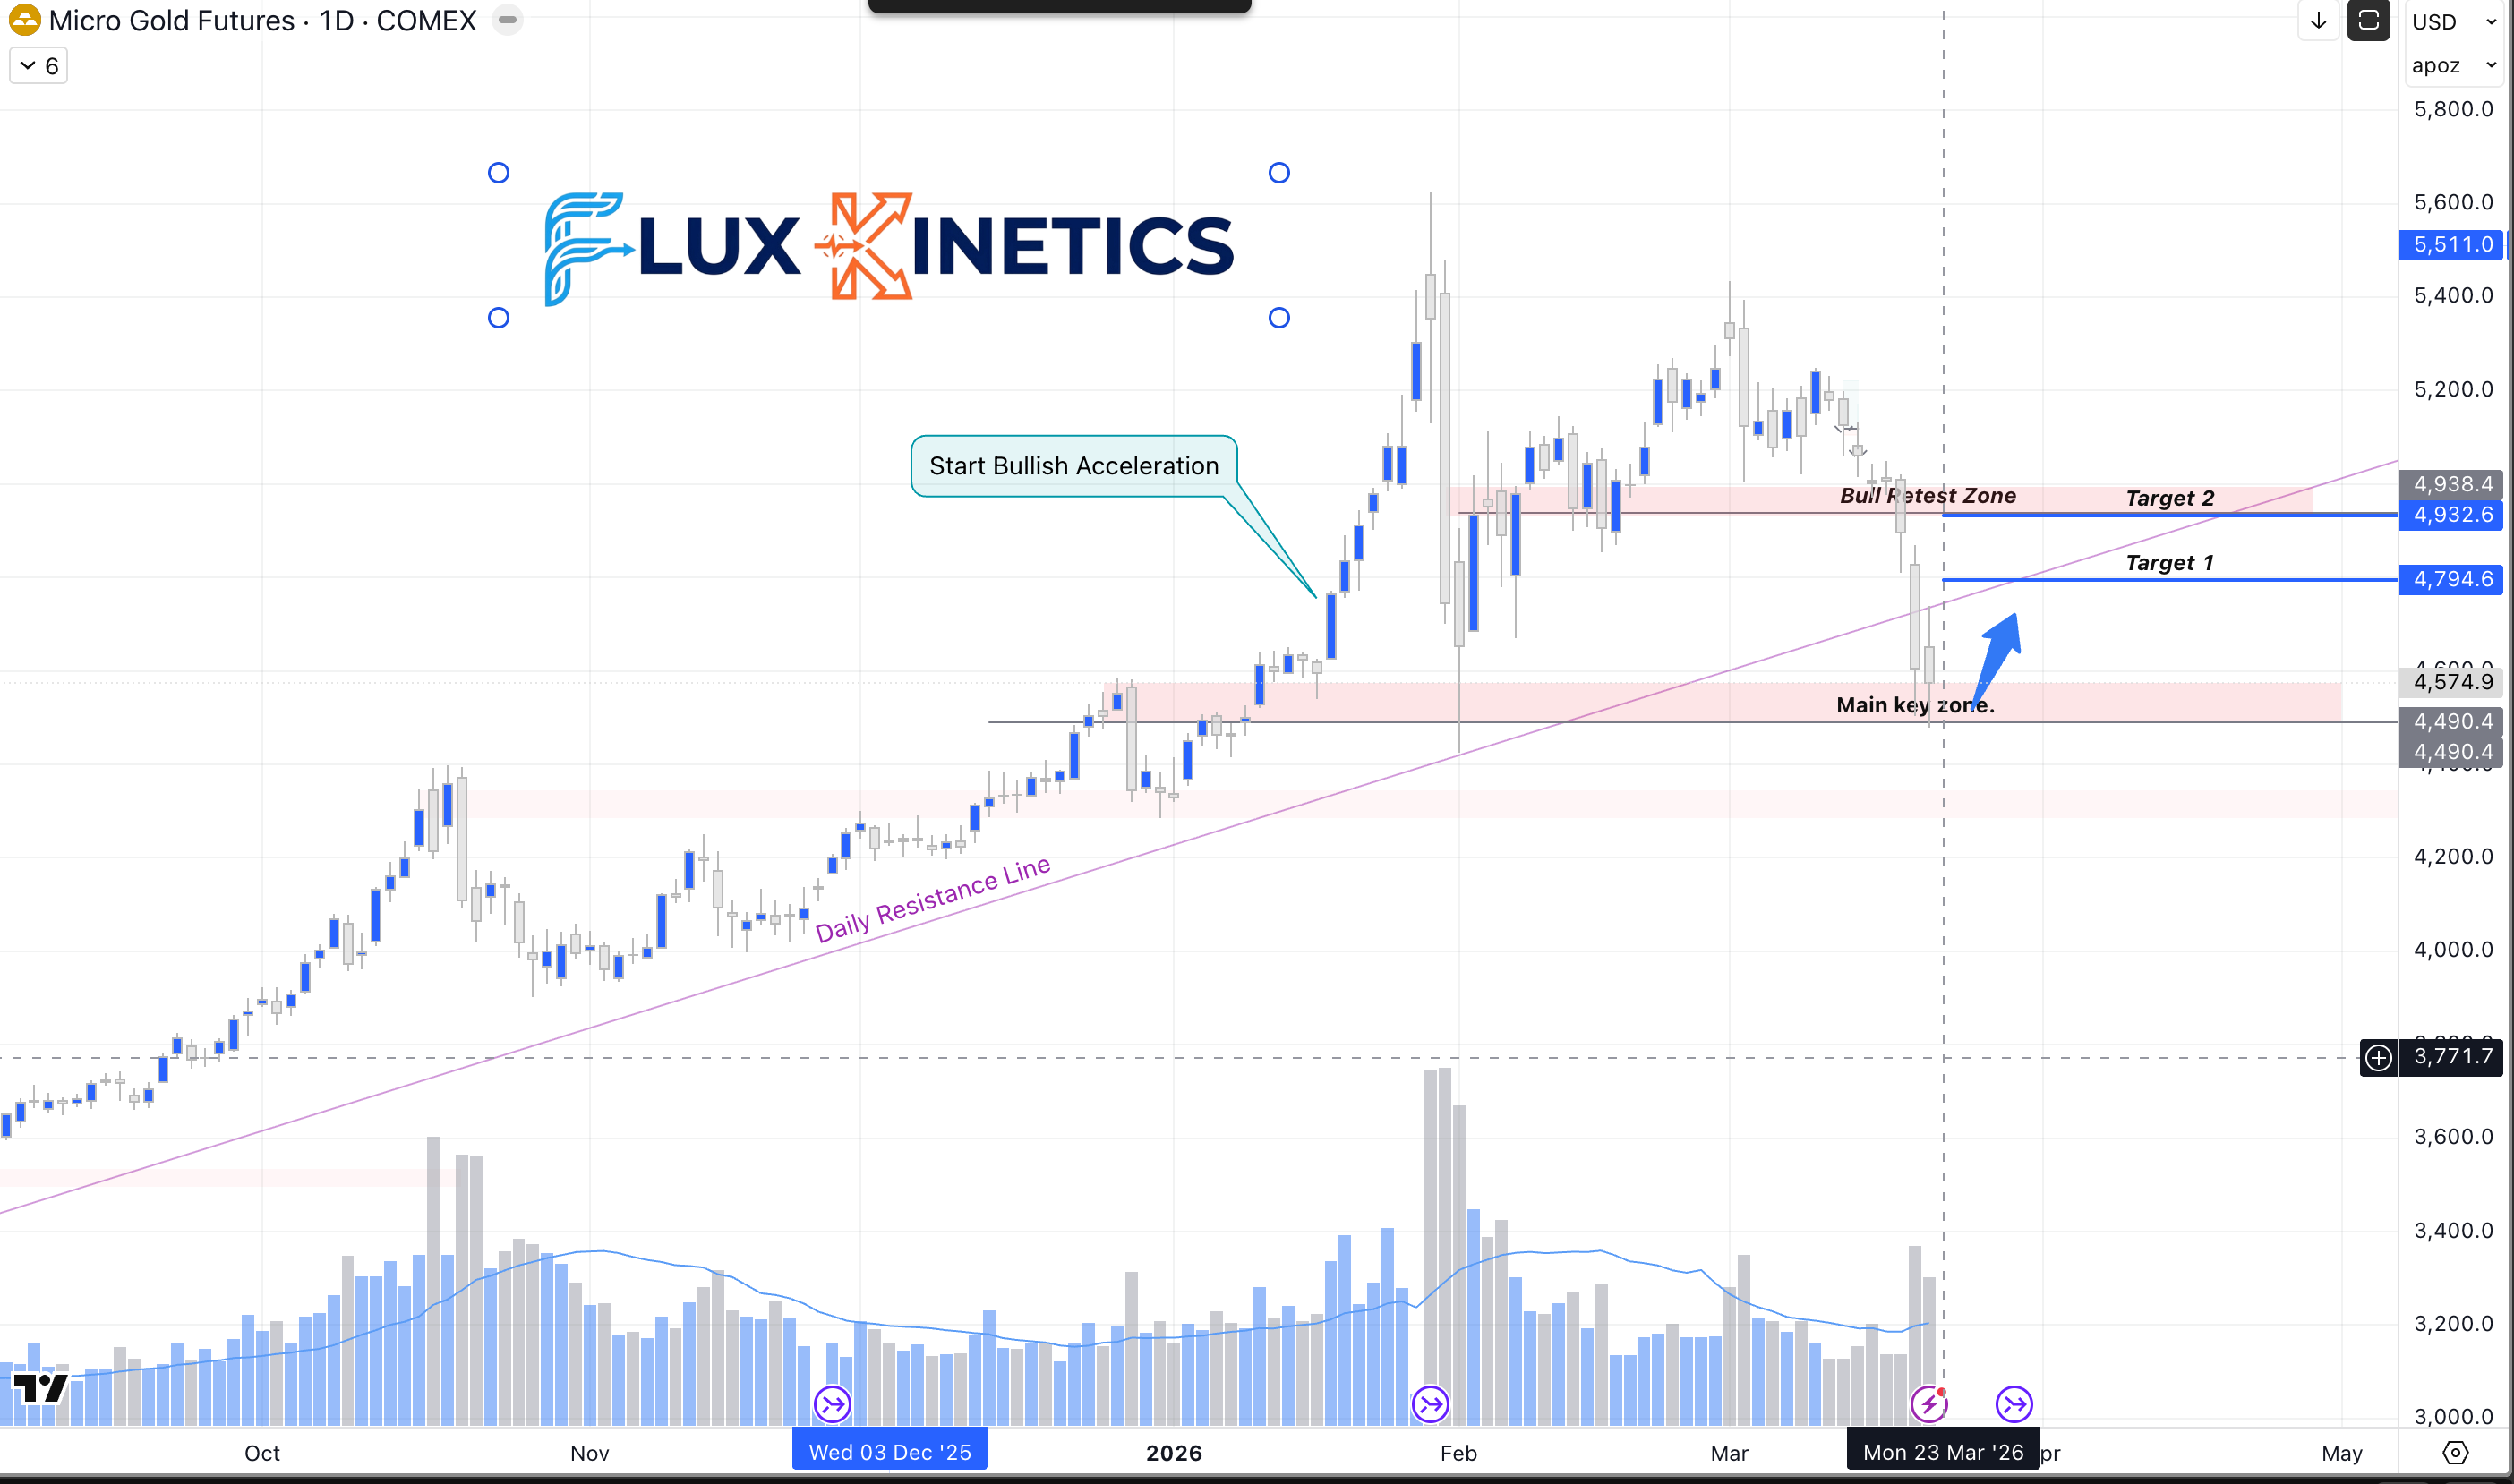
The Trade: Following our analysis from previous weeks, the “Bull Retest Zone” didn’t hold after 3 attempts and we went straight back to the “Main key zone”.
If prices open at $4500, I will enter a pull back trade on the “Main key zone” with a stop loss below $4440 to reach Target 1 as a first take profit. This will give us a 4:1 Reward/Risk ration.
Reduce the risk? wait for a second upward test on the main key zone before entering the long trade.
“Main key zone” not holding ? Short trade toward $4300 level.
CHOKEPOINTS AND CAPITAL FLOWS
Three bottlenecks seized the market this week. Capital is repricing all of them.
First, Strait throughput. 21 tankers since late February. Down from 138 per day. A 97% collapse. The only alternatives are the Saudi East-West Pipeline to the Red Sea, already rerouting 3.8 million barrels per day, and the Cape of Good Hope, which adds 10 to 14 days per cargo.
Second, SPR release logistics. As I wrote last week, barrels in a salt cavern are not barrels on a tanker. The 400 million barrel headline sounds huge. The combined global release rate from 31 countries with different infrastructure lands around 3 million barrels per day. Against an 8 million barrel per day hole, that leaves a 5 million barrel deficit every single day.
Third, LNG liquefaction spares.. Every EPC contractor with LNG experience is about to get a phone call.
Week Ahead: What to Watch
Wednesday March 26: EIA Weekly Report (week ending March 20). First print after the infrastructure damage.
Golden Pass update. If first-cargo loading confirms this month, JKM and TTF reprice higher. If delayed into April, Henry Hub reprices lower as feed gas backs up.
Friday March 28: CFTC Commitments of Traders. Managed money added 77,672 net-long positions in ICE Brent last week. Total: 428,704. If that number rolls over, the tape is closer to a top than most think.
Gold ETF flows. Three weeks of outflows, 60+ tonnes. If outflows stop, the liquidation is done and gold resets. If they continue, the capital drain has legs.
Action Items
For Traders: If the situation ease, immediate short above $100, stop at $103 daily close, target $93. That is a +7%.
For Operators: Front load Gulf Coast maintenance now. Domestic crude is plentiful. Secure cryogenic components and LNG spares immediately.
For Investors: Buy the builders. Avoid commodity ETFs long front-month crude. The $28 front-to-back gap means you buy at the top every time the contract rolls.
If this changed how you see the week, send it to one person who needs to see it too.
In case you have missed my previous article about the Gold’s new model:

Coming next:
Silver’s Split Personality: Monetary Metal Meets Industrial Chokepoint.
Copper at the Wall: When Every Grid Needs the Same Ton.
Share this with the person who always asks what actually moved this week and why. That is who Flux Kinetics is written for.
Flux Kinetics - Where Energy Meets Intelligence.
Wassim CHIADLI
This content is for educational purposes only and does not constitute financial, legal, or tax advice. All opinions and analyses are my own, and any actions you take are at your own risk after consulting an appropriate professional.