A compressor train hums at 3 a.m. on the US Gulf Coast, dumping megawatts of electric load into heat that nobody wants but everyone pays for. A 170,000 cubic metre LNG carrier waits offshore, every hour of delay burning charter at roughly 25,000 dollars a day and pushing the notional cargo value tens of basis points out of line with its paper hedge. In that noise and that heat sits the new base load of Europe and parts of Asia.
Most people still think of “gas markets” as pipeline systems and domestic hubs. Henry Hub in the US. TTF in Europe. City gate pressure, not hull drafts and canal drafts. The comfortable story says LNG is a flexible side show that steps in when a pipeline fails, then retreats when prices calm down.
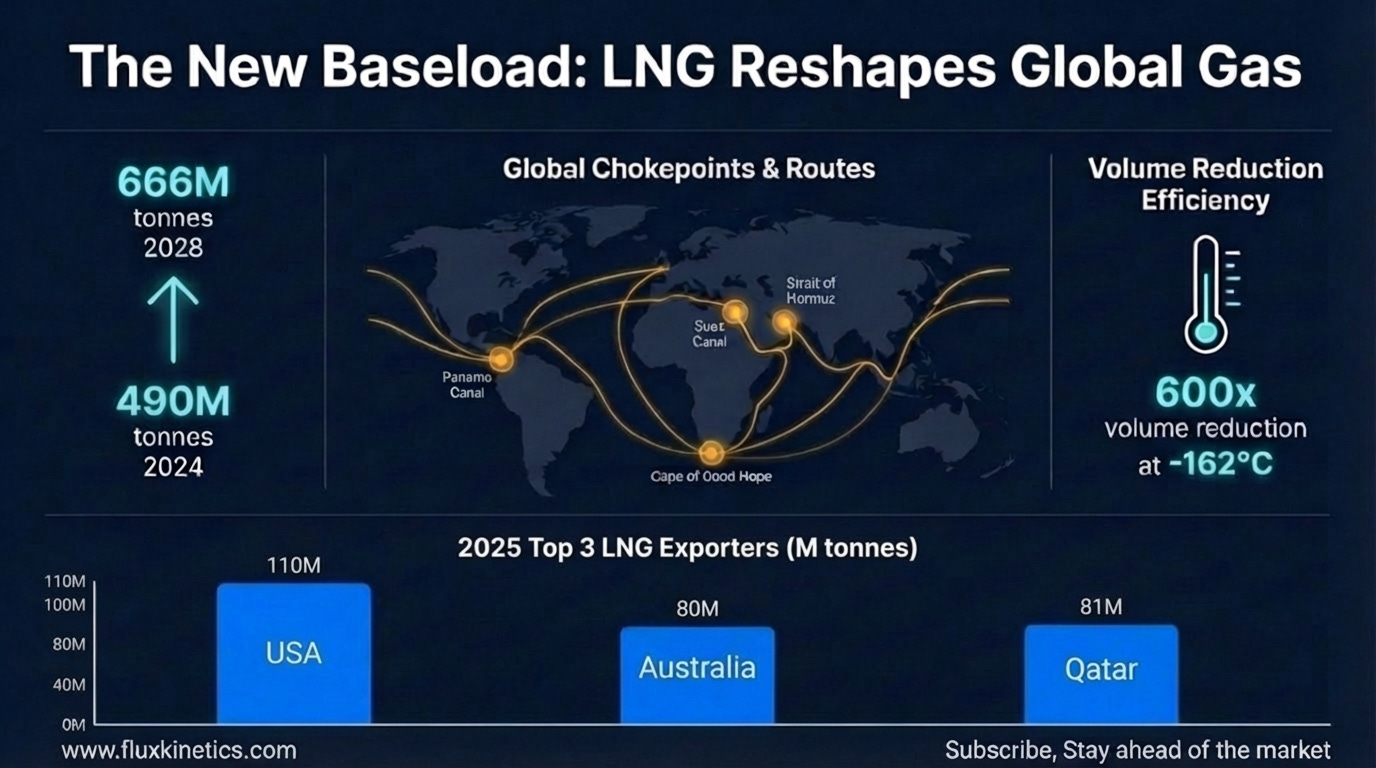
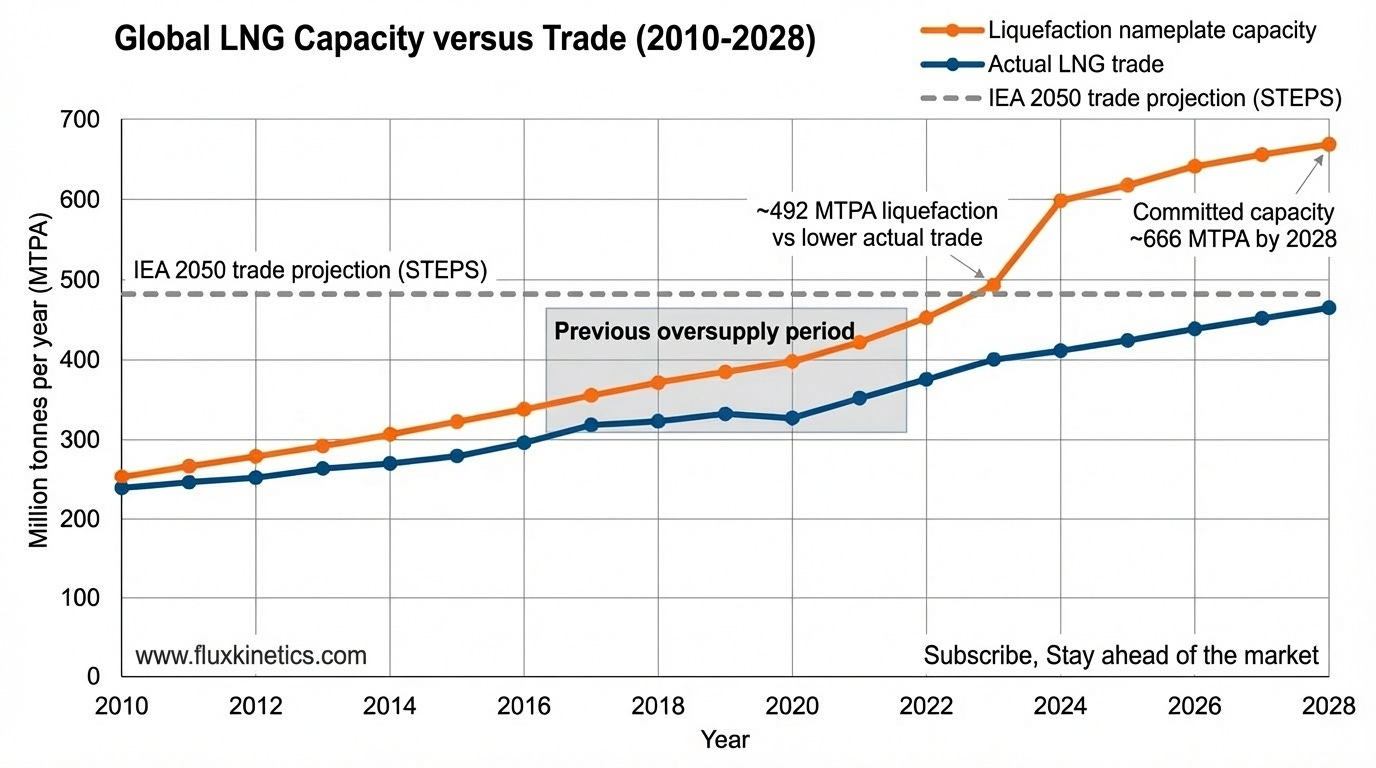
Here is what almost everyone misses. LNG is no longer a side show. With roughly 490 million tonnes per year of liquefaction installed by 2024 and another wave pushing nameplate capacity toward 666 million tonnes by 2028, the marginal molecule is increasingly a chilled liquid sitting in a storage tank, not a cubic metre pushed through “Soviet era” steel. That shift rewires price formation, trade routes and geopolitical leverage.
Here is what you will find:
From gas to liquid
How LNG is actually made
Who controls capacity
Routes, chokepoints, and prices
Operator’s diagnostic
From gas to liquid
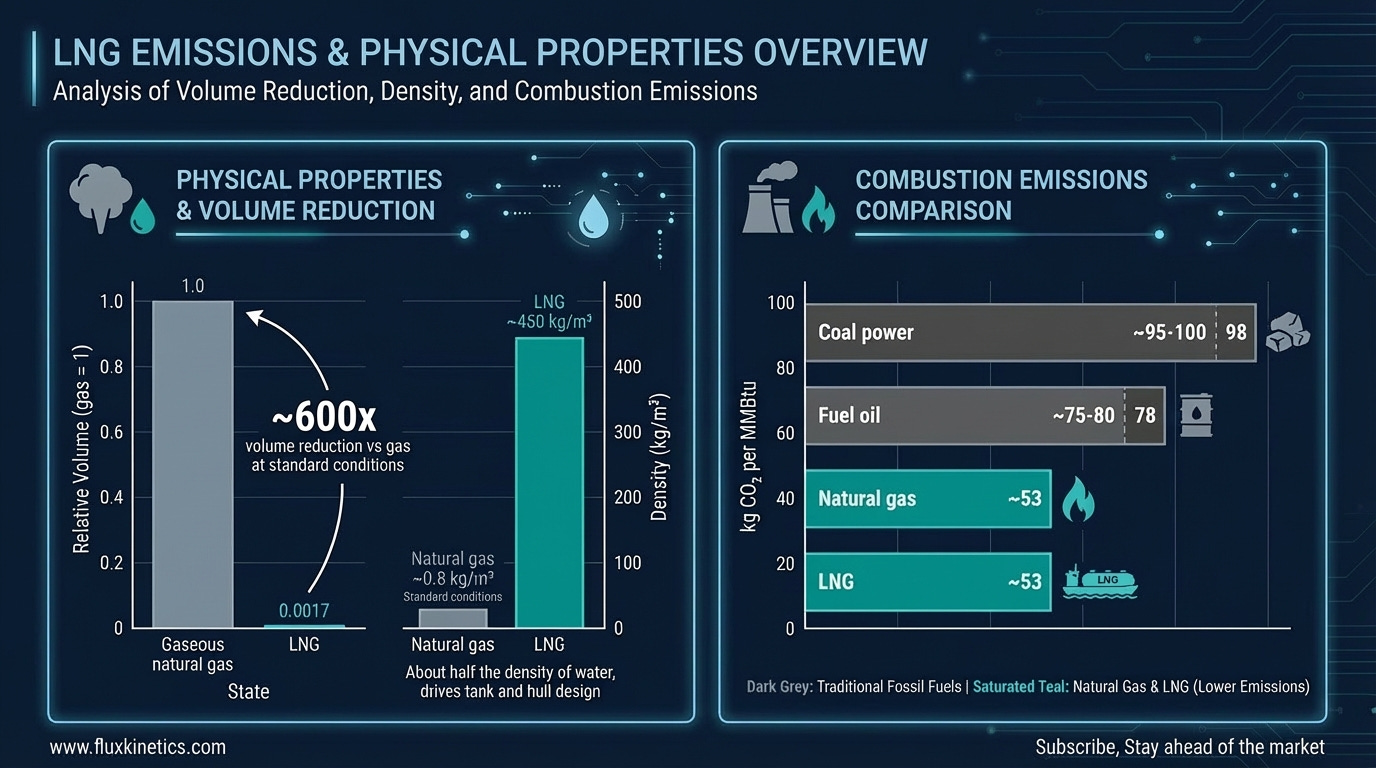
Gas, shrunk 600 times. LNG is natural gas cooled to roughly minus 162 degrees Celsius until it condenses. This shrinks its volume by around 600 times and turns a diffuse gas into a dense, transportable liquid. Physically, you trade pipeline pressure for refrigeration.
At typical composition LNG is 85 to 95 % methane, with small fractions of ethane, propane, butane and nitrogen. Methane is a small, light hydrocarbon molecule. Chilling it to cryogenic temperatures slows its motion so much that intermolecular forces pull it into a liquid.
That 600x volume reduction is not a rounding error. It is the only reason a 170,000 cubic metre ship can move the daily output of a medium-sized gas basin across an ocean and still make money.
The consequence is simple. Whoever controls liquefaction and re gasification controls long distance gas.
LNG is clear, odourless and about half the density of water in liquid form, which dictates tank and hull design. It burns hotter and cleaner than oil products, with roughly 30 to 40 percent less carbon dioxide per unit energy than oil or coal when combusted. It also emits vastly lower particulate and sulphur emissions.
Here is what you need to know: The methane that leaks before combustion traps around 80 times more heat than carbon dioxide over a 20 year period, so small losses along the supply chain can erase the apparent climate benefit.
“In LNG, the physics that shrinks gas 600 times also shrinks your margin for error.”
How LNG is actually made
From reservoir to cryogenic tank. The LNG chain starts like any gas project. Wells flow raw gas with water, CO2, sulphur compounds and heavier hydrocarbons to a processing plant. Only after the gas has been stripped of water and acid gases and brought to pipeline quality does liquefaction start.
Liquefaction trains are essentially giant refrigerators arranged in cascade. Compressors drive refrigerant loops that pull heat out of the gas step by step until it hits that minus (-162) degree threshold and collapses into liquid. Think of each train as a factory line where tonnes of gas per hour flow through aluminium plate-fin heat exchangers the size of houses.
The physics is simple. The engineering is not.
A modern export terminal might have 2 to 6 trains, each rated between 4 and 8 million tonnes per year. These feed full-containment tanks of 160,000 to 200,000 cubic metres that hold several cargoes at a time. Boil off gas generated as the tanks warm slightly is usually re-condensed or used as fuel.
Every train is a single point of failure. A cracked exchanger or compressor trip can remove several million tonnes a year of supply for months.
Upstream feed gas has to be consistent. Declining field pressure, rising CO2 content or water breakthrough can force derating or even mothballing of liquefaction capacity. This is why roughly one-third of global LNG plants have faced reliability or feedstock constraints in recent years.
For prices, this means nameplate capacity dramatically overstates usable supply.
Who controls capacity
Exporters, reserves, and the 2028 wave. The United States, Australia and Qatar currently sit at the top of the LNG export table. The US ships roughly 89 million tonnes annually, with Australia and Qatar close behind around 80 million tonnes each. Together they account for more than half of global traded LNG.
Behind them sit Russia, Malaysia, Algeria, Nigeria and a widening group of smaller exporters. The long-term story, however, is the aggressive build-out in the US and Qatar.
The part almost nobody models is how far ahead supply capacity is running relative to credible demand paths.
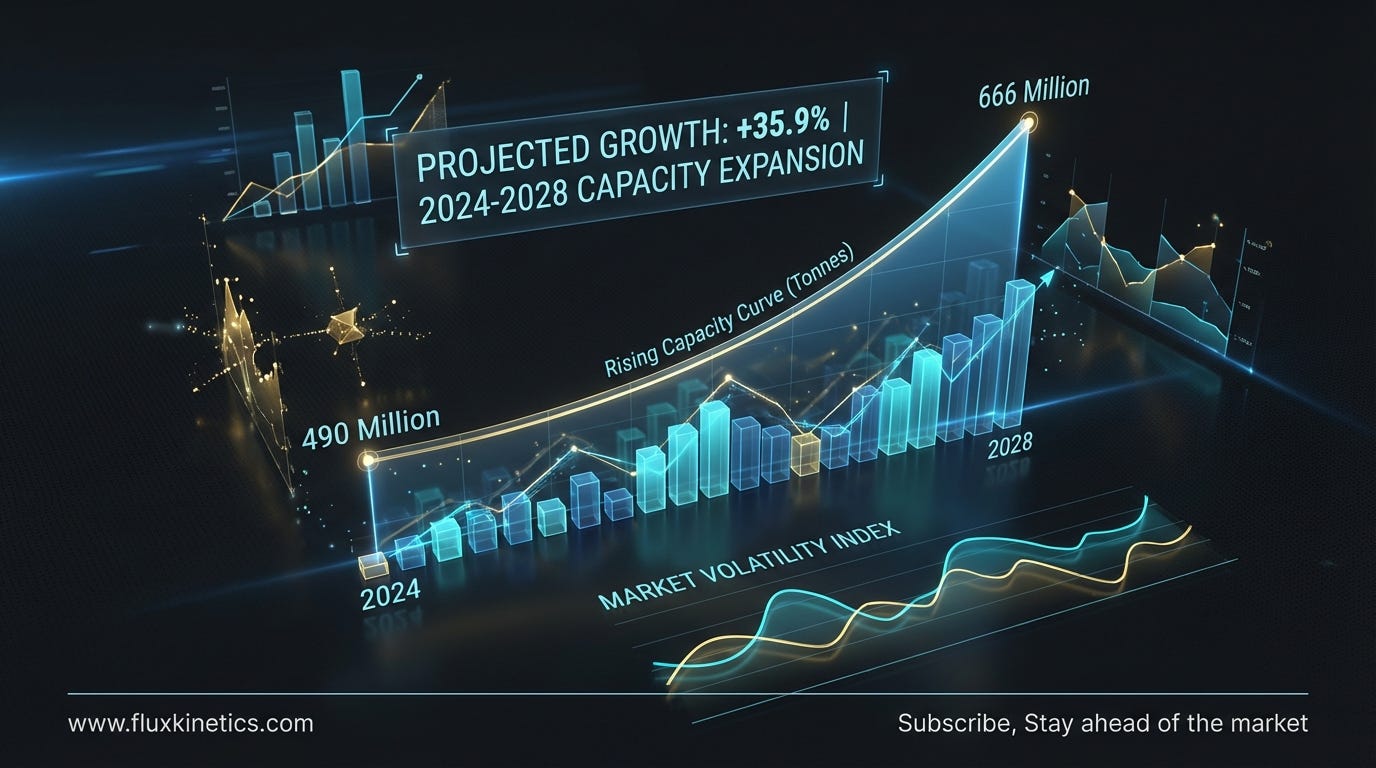
Global liquefaction capacity is set to rise from just under 500 million tonnes per year in 2024 to about 666 million tonnes by 2028. This is a roughly 40 percent jump based only on projects that are already financed and under construction. That scheduled build-out exceeds even the IEA’s long-term LNG trade projections for 2050 under stated policies.
In plain terms, by the end of this decade there is more concrete LNG steel planned than the world will need in 2050.
On the reserve side, Qatar, Russia and Iran control over half of global proven natural gas. Qatar’s North Field is the world’s largest natural gas reservoir with over 900 trillion cubic feet of non associated gas. These geological anchors sit underneath the entire LNG trade. That concentration means a handful of states can choose whether liquefaction underperforms or floods the market.
Qatar’s North Field expansion alone is designed to raise its liquefaction capacity from roughly 105 bcm to 193 bcm per year by 2030. The US has more than 70 million tonnes per year of new capacity under construction right now.
If all of this arrives on time into soft demand in Europe and slower emerging Asia, pricing power shifts sharply from sellers to buyers.
“When liquefaction outruns demand, gas stops pricing like scarcity and starts trading like stranded steel.”
Routes, chokepoints, and prices
Steel, canals and detours. LNG moves on a specialised carrier fleet. Typical modern vessels carry 170,000 to 174,000 cubic metres in membrane tanks, while Q-Flex and Q-Max designs stretch to 266,000 cubic metres. Each hull is a floating, cryogenic warehouse tied into a charter market that swings violently from boom to bust.
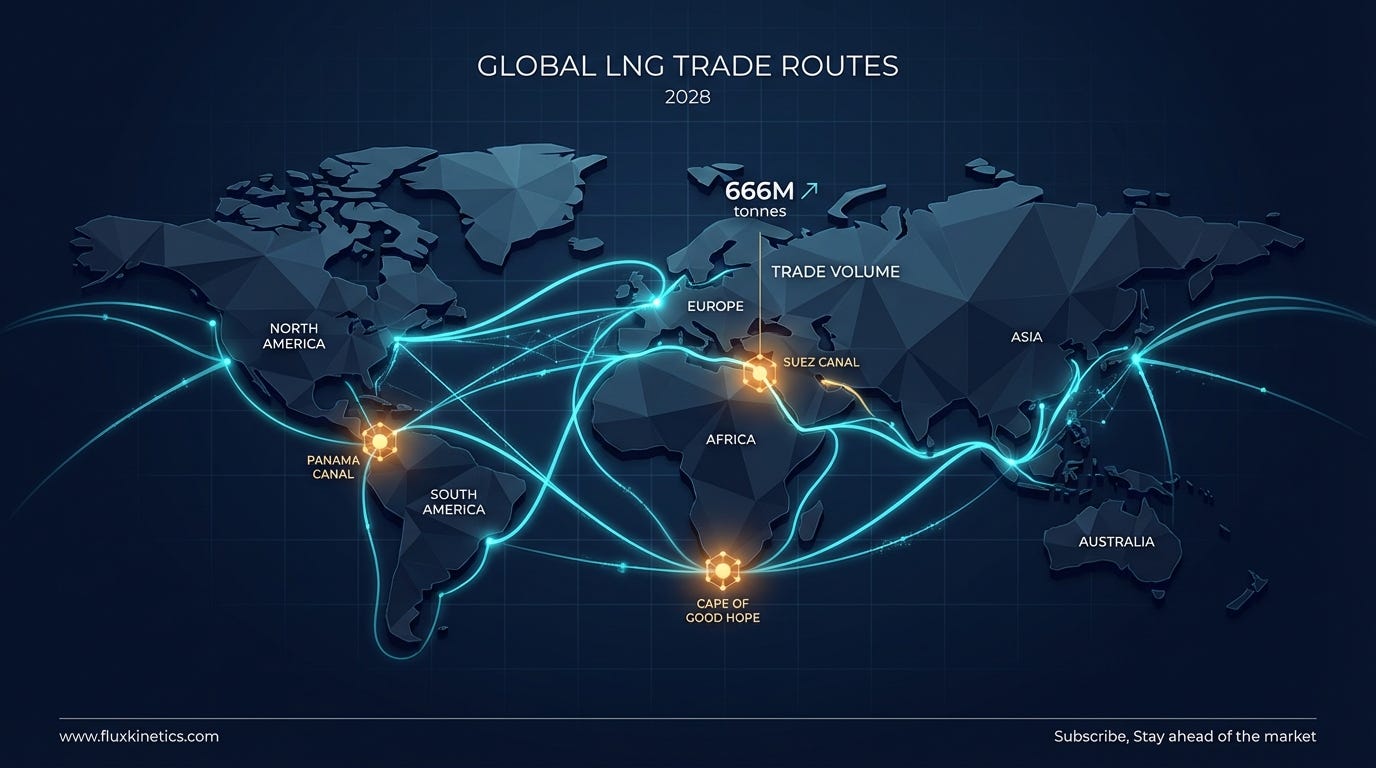
The physical links that matter most right now are Suez, Panama and the detour around the Cape of Good Hope.
In 2023 around 8 percent of global LNG exports transited Suez and 2.5 percent went via Panama. Drought in Panama and security risks in the Red Sea have since forced a dramatic reroute. By 2024 roughly 94 percent of US LNG cargoes bound for Asia went via the Cape of Good Hope. This adds roughly 20 days versus Panama and about 10 days versus Suez.
More time at sea means more hulls tied up and higher delivered cost at the margin.
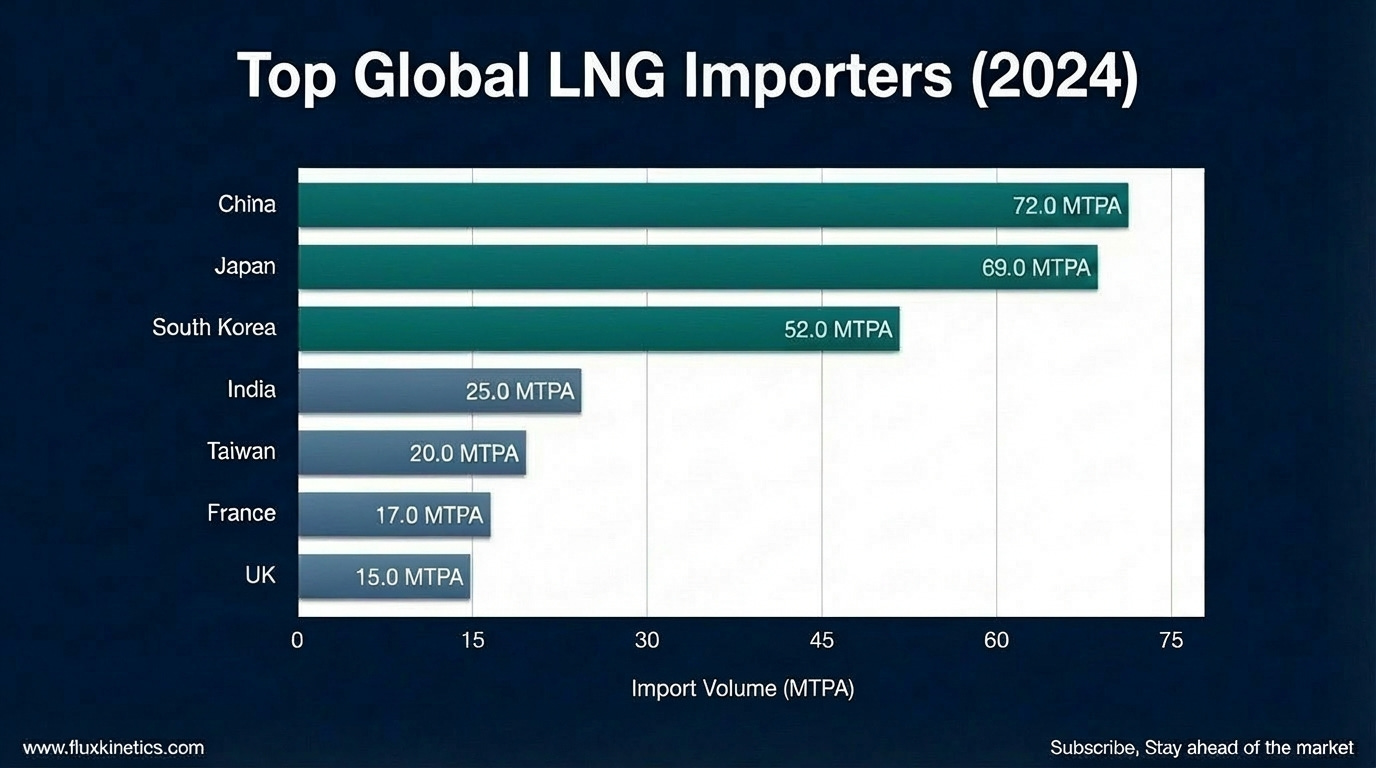
This routing friction has tightened the Atlantic basin. About 52 percent of US LNG exports in 2024 went to Europe, while Qatar doubled down on Asia with roughly 80 percent of its volumes landing there. Russia’s Arctic ambitions remain hamstrung by sanctions and pressure on residual buyers.
This is where it breaks for simplistic “global LNG is fully fungible” narratives. Route friction and politics carve the market into semi-connected basins.
At the same time, the LNG carrier market flipped from tight to loose. Spot charter rates for older steam-turbine LNG carriers collapsed to an average of about 25,000 dollars per day in 2024 as a record 70 new vessels hit the water ahead of delayed liquefaction projects.
Cheaper ships and longer routes partially cancel each other out. The remaining imbalance shows up in delivered spreads and utilisation.
Benefits, limits, and the next price regime
Why LNG won the last crisis. In everyday life LNG shows up as gas-fired power, industrial heat, district heating, and marine fuel. Once re gasified, the molecule is indistinguishable from pipeline gas feeding homes, steel mills and fertiliser plants.
The appeal during the post-2022 crisis was obvious. LNG could be redirected at the margin. Europe could replace lost Russian pipeline volumes with cargoes, paying whatever it took, instead of waiting for new pipes to be laid.
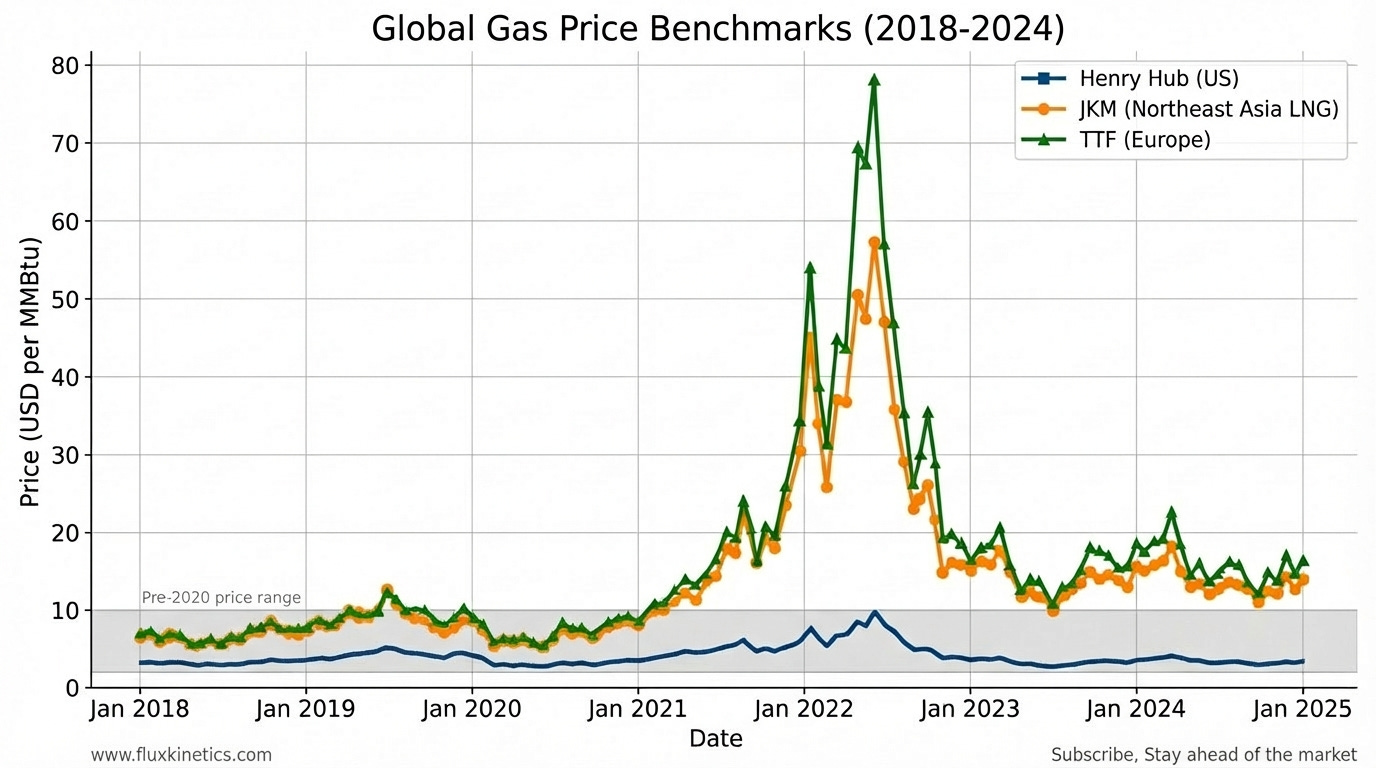
The price consequence was historic. Europe’s willingness to pay turned JKM and TTF into weapons pointed at the rest of the world.
From a system standpoint, LNG is highly capital intensive at both ends. Liquefaction terminals, storage tanks, jetties, re gas units and specialised carriers are all sunk assets. Once built, they create a strong incentive to keep molecules flowing, even into weakening demand.
That is exactly how overcapacity feeds price volatility.
Price formation itself is shifting. Long-term contracts historically indexed to oil still exist, but shorter-term and spot-linked contracts tied to JKM, Henry Hub, or European hubs like TTF are eating share. Daily assessments at these hubs now carry more weight for balance sheets than many internal cost curves.
When Henry Hub is cheap, US exporters with flexible destination clauses arbitrage into whichever basin pays the highest netback over freight. When JKM spikes on a cold Asian winter, cargoes peel away from Europe.
Under the hood, LNG prices are no longer just “gas prices”. They are a compressed signal of canal water levels, war risk premium, grid strain, and the speed of renewable build-out.
“Every extra day around the Cape of Good Hope widens the spread between paper convergence and steel reality.”
Operator’s diagnostic
The Exposure Matrix. Use this as an internal memo, not a talking point.
1. Map your dependence on LNG
Quantify what share of your gas or power portfolio is linked to LNG imports or LNG indexed prices.
Break exposure by basin: Atlantic vs Pacific vs Middle East flows.
Tag which contracts have destination flexibility and which are fixed.
2. Audit your chokepoints
List every canal, shipping lane, and terminal your supply relies on, with typical route days.
Identify single terminal dependencies on either the export or import side.
Check storage coverage in days of demand at receiving points.
3. Stress test price and volume
Run scenarios for 5, 10 and 20 dollar per MMBtu LNG at JKM and TTF.
Overlay disruptions: 30 to 90 day loss of a major exporter, canal, or gas unit.
Explicitly model how much demand you can shed or switch in each scenario.
4. Track the capacity wave against your contract roll-off
Build a simple timeline of global liquefaction capacity additions versus your long-term LNG contract expiries.
Flag years where your exposure shifts from term to spot.
Decide in advance whether you want to ride the cycle or flatten it.
For Traders
Express directional views via spreads: JKM-TTF, TTF-Henry Hub, and seasonal calendar spreads.
Size positions against concrete physical triggers like canal drafts, outage reports, and FID announcements, not just technical price charts.
For Operators
Secure redundant berthing and gas options where possible, including FSRUs as swing capacity.
Stagger maintenance on liquefaction trains, tanks and jetties away from peak seasonal windows.
For Investors
Tilt towards low-cost, well located liquefaction with advantaged feed gas and clear buyer pull, avoiding late cycle speculative projects.
Prefer regions with multiple supply options and robust storage over single route, single supplier dependencies.
Global gas prices are no longer dictated by the wellhead. The floor and ceiling are now set by the hum of a Gulf Coast compressor and the boil-off in a Baltic FSRU.
Closing
The LNG system is no longer a marginal balancing tool. It is the steel and refrigeration that now set the floor and ceiling for gas prices across continents, from the hum of a Gulf Coast compressor to the boil-off in a Baltic FSRU. The belief that “pipelines are primary, LNG is backup” broke in 2022 and has not been rebuilt.
You are no longer just watching a gas market. You are mapping a fleet, a set of chokepoints and a build-out of liquefaction that together write the price of resilience.
If you found this helpful, consider subscribing to Flux Kinetics and forwarding it to a friend or a colleague who cares about how electrons, metals, and policy intersect.
This content is for educational purposes only and does not constitute financial, legal, or tax advice. All opinions and analyses are my own, and any actions you take are at your own risk after consulting an appropriate professional.


Beast of a breakdown.
Good information about LNG overcapacity rewriting risk/reward.
I recently found out that Italy, while moving away from Russia's LNG supplies, increased its dependence on Qatar. Now, the supply is being affected.
Which links to your point that system shocks aren't so much about actual supply but the logistics of it.