

Rockets Up, Feathers Down.
The Truth and Brutal Physics of Gasoline Pricing.

Why your pump price rises in hours but takes weeks to fall…
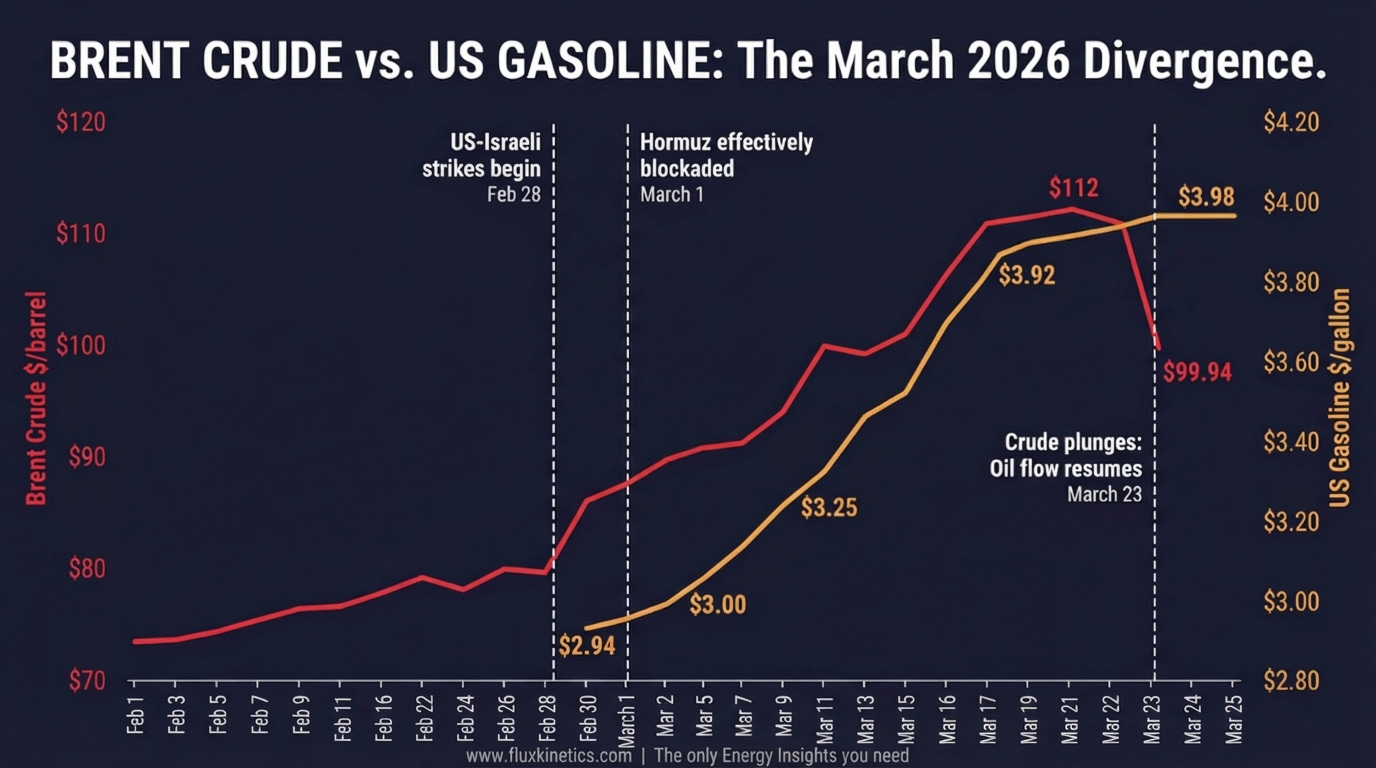
On March 23, Brent crude fell 11% in a single session. $12.25 per barrel, evaporated, gone. WTI dropped to $88.13 after trading north of $112 just days earlier. Donald Trump mentioned talks with Iran, and the oil futures market cratered before lunch with a downswing during the intraday session of -14% in 15 minutes! By that afternoon, the national average for a gallon of regular gasoline stood at $3.98, per AAA. It had not budged.
The comfortable story is that gas prices track oil prices. When crude goes up, gas goes up. When crude comes down, gas follows. This is roughly true in the same way that saying “weather follows the seasons” is roughly true. It misses the mechanism. And the mechanism is where you either make money or lose it.
Here is what almost everyone misses. The journey from an oil barrel trading on a screen in New York to a gallon of gasoline flowing into your car in New Jersey takes two to four weeks of physical movement through pipes, reactors, trucks, and underground tanks. Prices at the pump rise on expectations of what the NEXT delivery will cost. They fall on the reality of what the LAST delivery actually cost. That asymmetry is not corruption. It is accounting. It is physics. And it costs American consumers between $2 and $4 billion every single year. This is a next-quarter story with a structural tail that runs for years, and understanding the plumbing gives you an edge that most retail investors and nearly all politicians lack.
Brief contents
The barrel-to-bumper pipeline
Replacement cost: the hidden engine
Refinery squeeze and the crack spread
The chokepoint the market forgot
The exposure diagnostic
“Crude trades in seconds. Gasoline moves in weeks. The spread between those two clocks is where the money goes.”
The barrel-to-bumper pipeline
A barrel of crude oil is 42 gallons. It yields roughly 19 to 20 gallons of gasoline, 11 to 12 gallons of diesel, and a grab bag of kerosene, jet fuel, asphalt, and petrochemical feedstocks. None of this happens instantly.
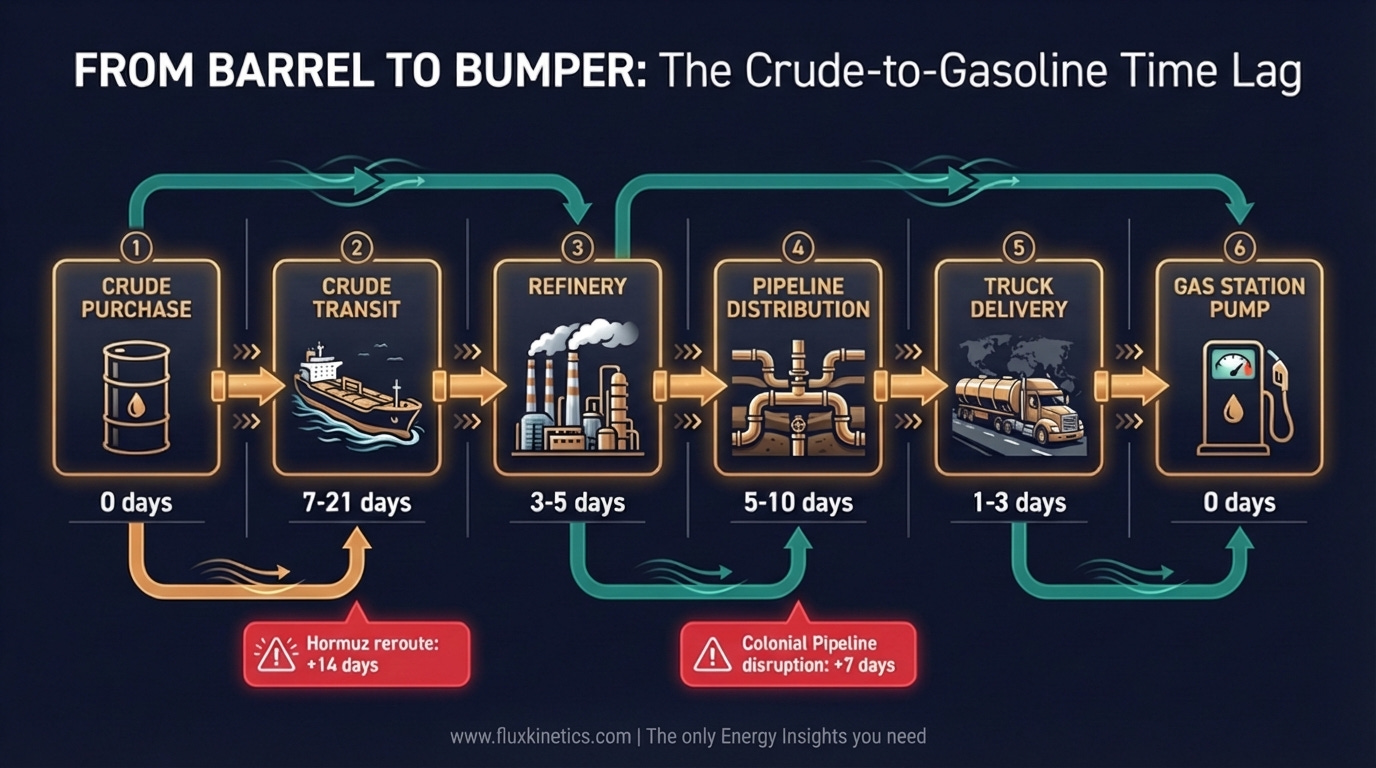
Step one: a refiner buys crude. On the US Gulf Coast, that purchase is typically pegged to WTI or a Gulf Coast sour benchmark. The refiner may buy on a 30 to 90 day term contract or on the spot market. Either way, the crude must physically arrive. If it comes by tanker from the Middle East, transit time was 30 to 40 days before the Strait of Hormuz blockade. Now, with ships rerouting around the Cape of Good Hope, add another 10 to 15 days. If it comes by pipeline from the Permian Basin or Western Canada, figure 5 to 15 days. The crude then enters the refinery’s atmospheric distillation column (the tower where it gets heated to separate into product streams by boiling point), and a given batch takes 2 to 3 days from crude charge to finished gasoline.
Step two: refined gasoline moves to a distribution terminal. On the East Coast, the dominant artery is the Colonial Pipeline, carrying roughly 2.5 million barrels per day of refined products from Houston to Linden, New Jersey. Transit time: 14 to 18 days. From the terminal, a tanker truck carries 8,000 to 9,000 gallons to a gas station with underground storage tanks holding 20,000 to 30,000 gallons. A busy station burns through that inventory in 3 to 7 days.
Add it up. From crude purchase to gasoline in your tank: two to four weeks in normal conditions. Today, with Hormuz disrupted and tanker reroutes in effect, that window stretches longer.
The price of crude oil constitutes about 45% of what you pay at the pump, per the EIA’s latest breakdown for 2026. Federal and state taxes account for roughly 15 to 20%. Refining costs and profits, about 15 to 20%. Distribution and marketing, 10 to 15%. The retail station margin is tissue-thin: 2 to 4 cents per gallon. If you think the guy behind the counter is getting rich, look again.
Replacement cost: the hidden engine
This is where the asymmetry lives, and I have watched it confuse journalists and legislators for twenty years.
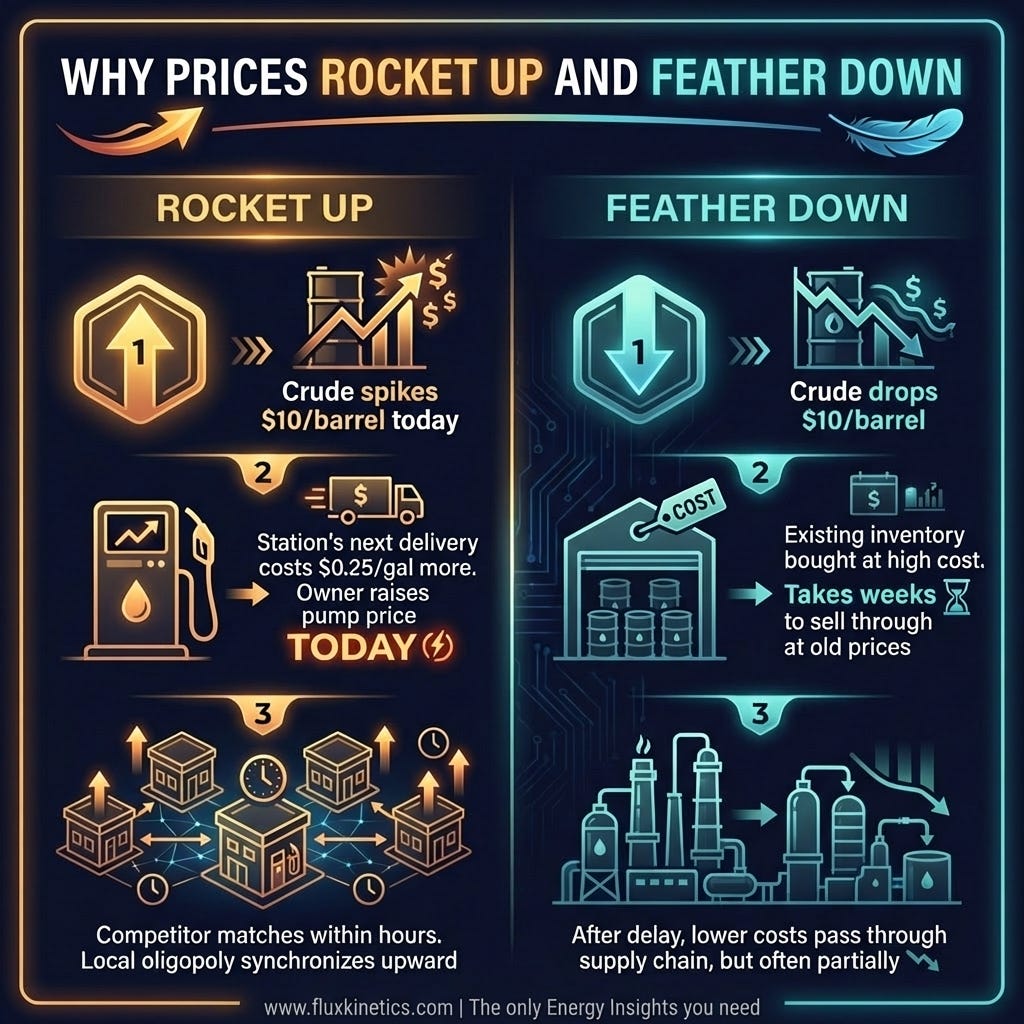
Gas station owners do not price based on what they paid for the fuel already in their underground tanks. They price based on what the NEXT truckload will cost. Economists call this replacement cost accounting. It is rational. If crude spiked $10 today and the station’s next delivery in three days will be $0.25 per gallon more expensive, the station raises its pump price today. If they do not, they sell their existing inventory at a loss relative to what it costs to restock. With margins of 2 to 4 cents per gallon, absorbing a quarter’s worth of price increase would bankrupt them in a week.
So prices rocket up. The FTC published a study analysing 15 years of daily data from over 150,000 gas stations. The finding: pump prices rise more than four times faster than they fall after equivalent crude oil movements. About 70 to 80% of a crude oil increase passes through to the pump within one week. Research from the Dallas Federal Reserve found roughly 12% of a crude price increase hits retail gasoline within the first day alone.
Now flip it. Crude crashes, as it did on March 23. The station still has fuel in the ground that was bought at the higher price. The next delivery is cheaper, but the station owner faces no competitive pressure to slash prices immediately. Here is the catch. In local fuel markets, which are oligopolistic (a handful of stations within a five-mile radius competing for the same commuters), no single station has an incentive to cut first. If you drop your price by 10 cents and your competitor across the street drops by 5, you gain a few extra fill-ups but you just gave away margin on every gallon. So everyone drifts down slowly.
The FTC data shows only 40 to 50% of a crude oil decrease reaches the pump within four weeks. The full pass-through takes six to eight weeks. During that gap, retailers capture expanded margins. Multiply that across 150,000 stations and 378 million gallons of daily US consumption, and the asymmetry transfers roughly $2 to $4 billion per year from consumers to the retail and wholesale fuel chain. Not as conspiracy. As structure.
“The station owner does not price what is in the ground. He prices what it costs to fill the ground again. That single sentence explains 90% of the rage at the pump.”
Refinery squeeze and the crack spread
The current crisis amplifies every layer of this. The Strait of Hormuz blockade, now in its fourth week as of late March 2026, has removed an estimated 7 to 10 million barrels per day of Middle East production from accessible supply as per first estimations. Brent crude surged approximately 50% from pre-conflict levels. Iraq declared Force Majeure, cutting Basra output from 3.3 million bpd to 900,000 bpd. The US lifted sanctions on 140 million barrels of Iranian crude already at sea on March 20, a sign of how acute the supply panic became.
But here is the thing. High crude prices do not automatically mean proportionally higher gasoline prices, and low crude prices do not automatically mean proportionally lower gasoline prices. The crack spread (the difference between wholesale gasoline price and the crude oil input cost, which serves as a proxy for refinery profitability) is an independent variable. And it is widening.
The EIA’s latest Short-Term Energy Outlook projects gasoline crack spreads in 2026 will be wider than in the previous two years. This matters enormously. US refinery capacity has shrunk by approximately 400,000 barrels per day due to closures, including LyondellBasell’s Houston refinery in Q1 2025 and Phillips 66’s Wilmington plant. No new US refinery has been built from scratch since 1977. The remaining fleet is running at 91.4% utilisation as of mid-March 2026, per EIA data. There is almost no slack.
Marathon Petroleum reported a 44% jump in refining margins in Q4 2025. Refiners are not the villains of this story. They are the bottleneck. And bottlenecks collect rent.
If the Iran conflict resolves and crude drops back toward the EIA’s pre-crisis forecast of $74 per barrel for 2026, gasoline crack spreads will remain elevated because the underlying refinery capacity shortage persists. The crack spread acts as a floor under pump prices even when crude falls. The real supply constraint in American fuel markets is not crude oil. It is the hardware that turns crude into something your engine can burn.
I have seen this pattern before, in 2013-2014 and again in 2022. Crude spikes, everyone screams about oil companies. Crude falls, everyone expects instant relief. The refinery margin quietly widens, and nobody mentions it.
Watch how the refinery process transforms crude oil into the gasoline that powers your car:
The chokepoint the market forgot
The Strait of Hormuz handles approximately 20% of global oil and liquefied natural gas flows. When Iran blocked from February 28, the world rediscovered a lesson it learns once per decade: geography is a physical constraint, not a line on a map.
But there is a domestic chokepoint that receives almost no attention. The Colonial Pipeline moves 2.5 million barrels per day of refined product from the Gulf Coast to the Eastern Seaboard. That is one pipe serving 100 million people. When Colonial went down for six days in May 2021 due to a ransomware attack, gas stations from Georgia to Virginia ran dry within 72 hours. That vulnerability has not been fixed. It has been patched with cybersecurity upgrades and inventory protocols, but the physical reality remains: the East Coast is a pipeline-fed monoculture for gasoline supply.
If Hormuz stays blocked through the summer 2026 driving season, and US refineries are already running above 91% with no new capacity, and the Colonial Pipeline is the sole major artery for East Coast supply, it gets ugly. On current trajectory, if Brent sustained above $120 through Q2 2026, the EIA’s March STEO implies retail gasoline could average above $4.00 per gallon nationally for the quarter, with West Coast prices potentially exceeding $5.50.
What would break this thesis? A rapid full Hormuz reopening would crash crude prices. But the pump price decline would take four to eight weeks to realy happen... The structural refinery capacity shortage would persist regardless. Only significant new refining capacity, which is years from commissioning even if approved today, would close the crack spread gap. This is not a thesis that hinges on geopolitics alone. The plumbing is permanent.
“You can resolve a war in a week. You cannot build a refinery in a week. That is the spread the market has not priced.”
My Flux Kinetics diagnostic :
1. Map your crude-to-pump lag for your region.
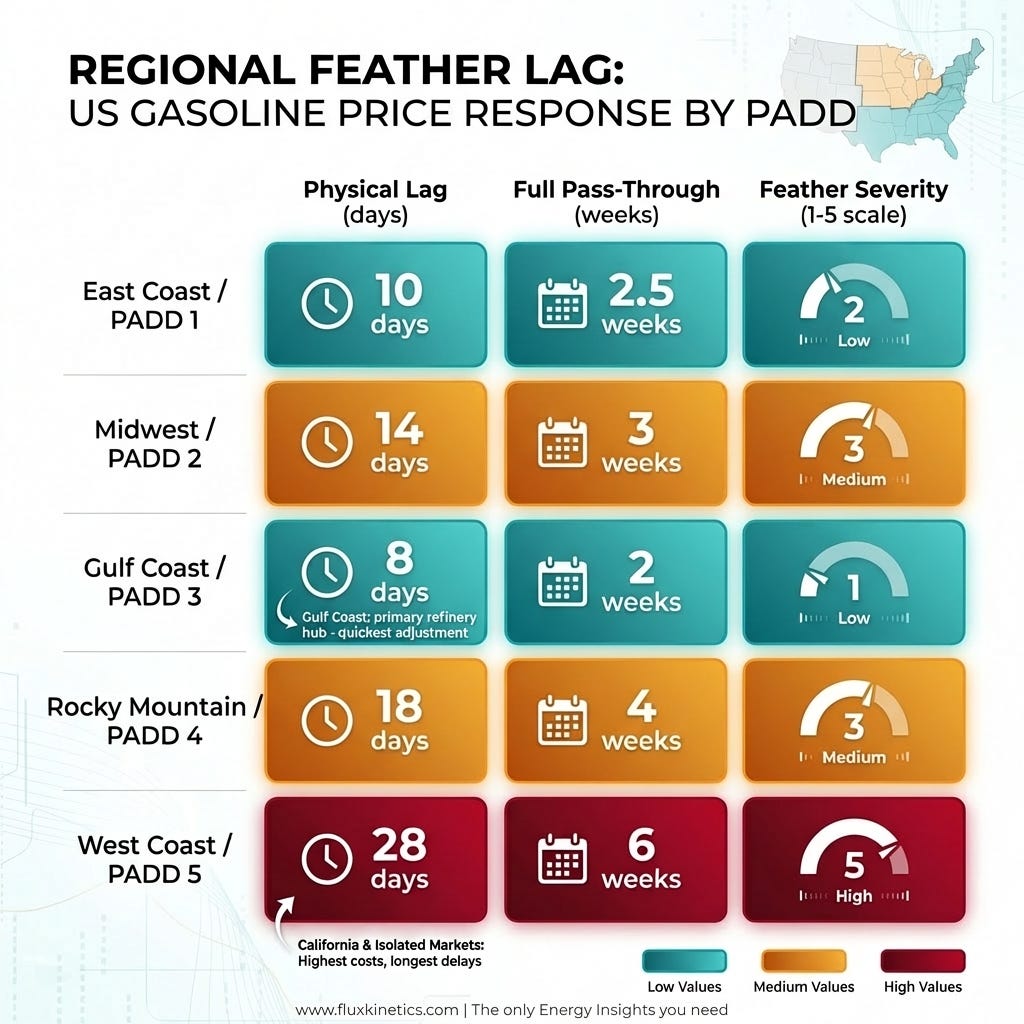
East Coast (PADD 1): 17 to 25 days (Colonial Pipeline transit plus station turnover).
Gulf Coast (PADD 3): 5 to 10 days (local refineries keep it shortest).
West Coast (PADD 5): 20 to 30 days (CARBOB rules and shipping create the longest feather effect).
Midwest (PADD 2): 10 to 18 days (mixed pipelines and refining).
2. Track the crack spread, not just crude.
Pull the 3:2:1 crack spread (three barrels crude, two gasoline, one diesel) from EIA or CME data. When the crack spread widens even as crude falls, retail prices will stay elevated. The crack spread is the leading indicator. Crude alone will mislead you.
3. Time your fill-ups using the feather lag.
When crude has fallen for 3 to 5 days but pump prices lag behind, you should wait to Fill Up. When crude rises for 2 to 3 days, fill immediately because the rocket heads your way soon.
4. Evaluate refiner exposure if you hold energy equities.
Companies that refine oil and also move it through pipelines (like Marathon, Valero, and Phillips 66) profit the most right now because the gap between crude cost and gasoline price keeps growing. Oil producers benefit from high crude prices too, but they are drilling less and spending carefully. So right now, refining and pipeline companies are the better bet over companies that just pump oil out of the ground.
5. Watch for regulatory signals.
California is pushing gas companies to be more transparent about pricing, which could help prices drop faster after crude falls. The FTC has data backing this up. Watch for similar moves in other states.
Crude oil trades in seconds. Gasoline moves through pipes and trucks over weeks. The space between those two realities is where the pricing asymmetry lives, and it is structural, not criminal. The Hormuz crisis made it spectacularly visible: Brent dropped 11% on March 23 while pump prices sat at $3.98 and barely flinched. But the mechanics were there before the war and will be there after it ends. Shrinking refinery capacity and widening crack spreads mean the feather falls even slower now than it did a decade ago.
You now see the pipe from barrel to bumper. Most people will still be arguing about conspiracies at the gas station.
In case you’ve missed my previous article about LNG (Liquefied natural gas):

Coming next:
Silver is doing two jobs at once. The market hasn’t priced that tension yet.
Every grid in the world needs the same copper. Someone is going to run short.
Flux Kinetics - Where Energy Meets Intelligence.
Wassim CHIADLI
This content is for educational purposes only and does not constitute financial, legal, or tax advice. All opinions and analyses are my own, and any actions you take are at your own risk after consulting an appropriate professional.
Nice way to patiently walk readers through the actual pipeline. See what I did there?
ba dum tsh.
And yes, station owners price for the next truck instead of the fuel already in the ground, so your rockets up, feathers down pattern isn't evil but more like inevitable math within thin margins.
Nice one.
There is a lot of information in here. Would you please separate it into 3 smaller points?