

Oil sold the reopening

The physical market still does not look loose
Dear Executives, Traders, Investors, and Friends
Oil finally gave back the premium it picked up during the Iran shock.
Brent settled at $71.99/bbl. WTI finished at $69.23/bbl. Brent lost 10.9% on the week. WTI lost 9.6%. WTI closed below $70 for the first time since the day before the war started.
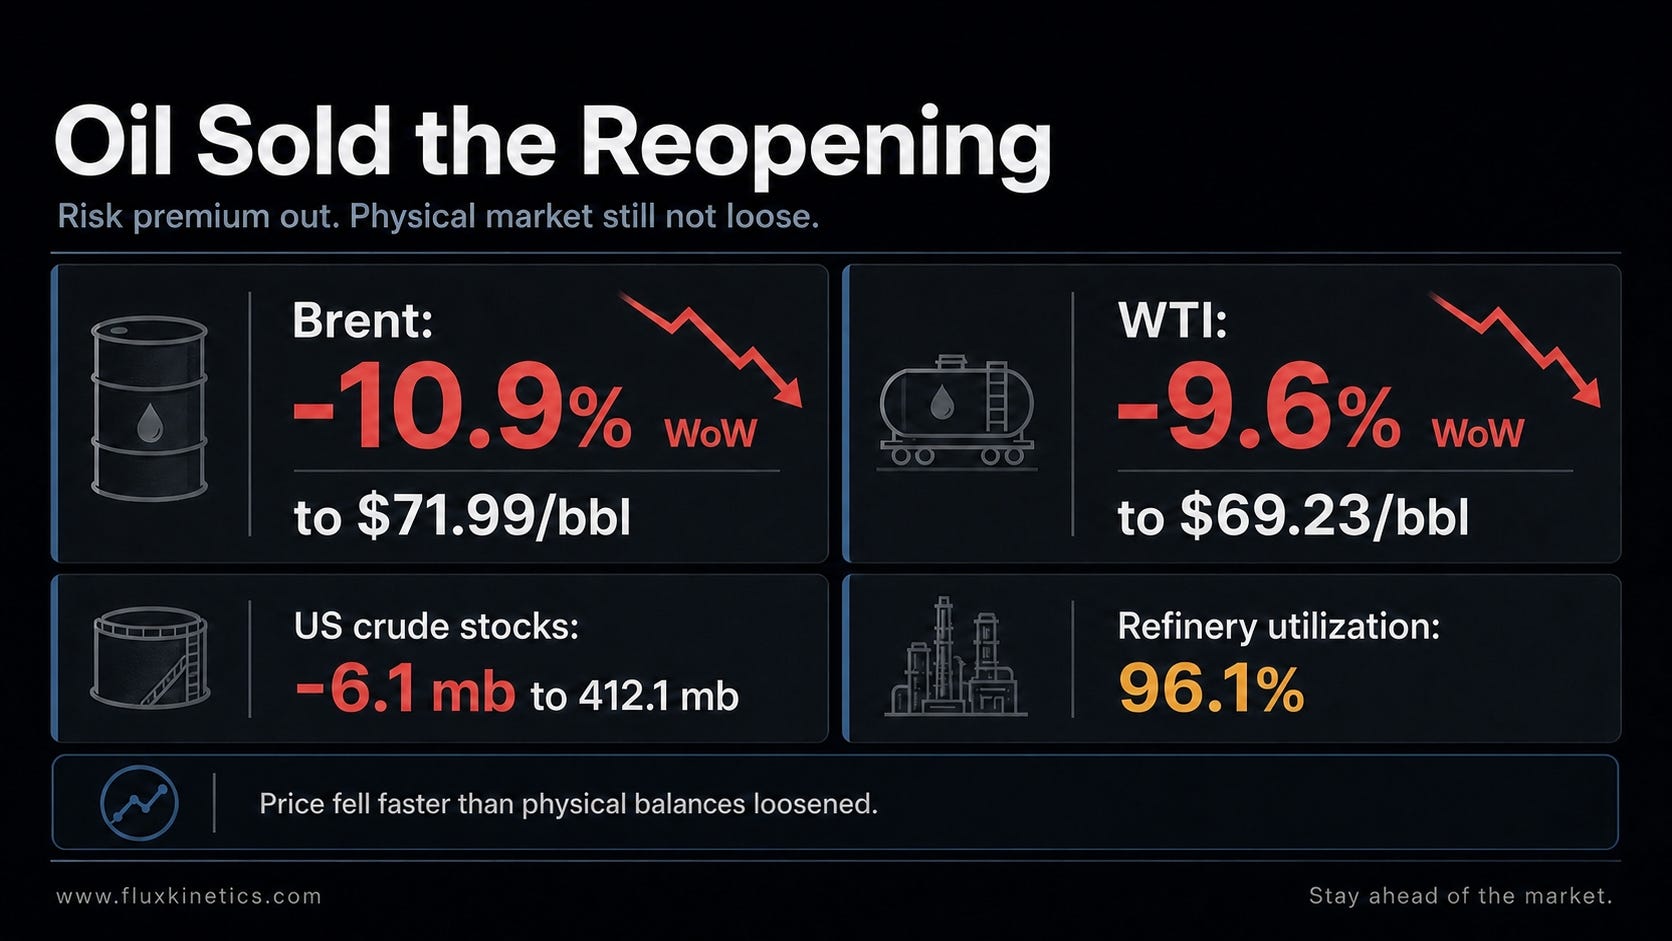
The trigger was simple. Tankers kept moving through Hormuz. Around 20 vessels cleared the strait in a single day, and traffic doubled in 24 hours. Risk premium left the screen faster than barrels arrived on shore.
What I watched this week
Crude still drew hard
Refineries stayed at 96%
Gas storage stayed balanced
Projects kept getting sanctioned
Copper held while oil collapsed
Rig count kept climbing
Oil tanks beat tape
The screen got crushed but the tanks did not confirm any panic.
U.S. commercial crude inventories fell 6.1 million barrels to 412.1 million. Crude stocks are now 7% below the five-year average. Refineries ran at 96.1% of capacity. Crude inputs averaged 17.1 million b/d.
Gasoline stocks built 2.1 mb. Distillate stocks built 3.1 mb. That softens the picture, but distillate is still about 10% below the five-year average. Total commercial petroleum inventories only slipped 0.5 mb on the week.
So yes, flat price broke lower.
🔁 Found this useful?
Flux Kinetics runs on word of mouth. If this note sharpened how you see the week, one forward to the right person is worth more than any algorithm 📨
That was not a clean bearish inventory report… It was a kind of fast repricing of war risk.
Watch out at the opening of the weel if a real stability of hormuz is back… otherwise you might see a new standardised premium above 70%…
If you are a curious mind, here with a distillation process simplified :

THE NUMBER: 6.1 mb.
That is the crude draw that stops this from being a clean surplus story.
Gas stayed balanced
Gas was in a different lane this week:
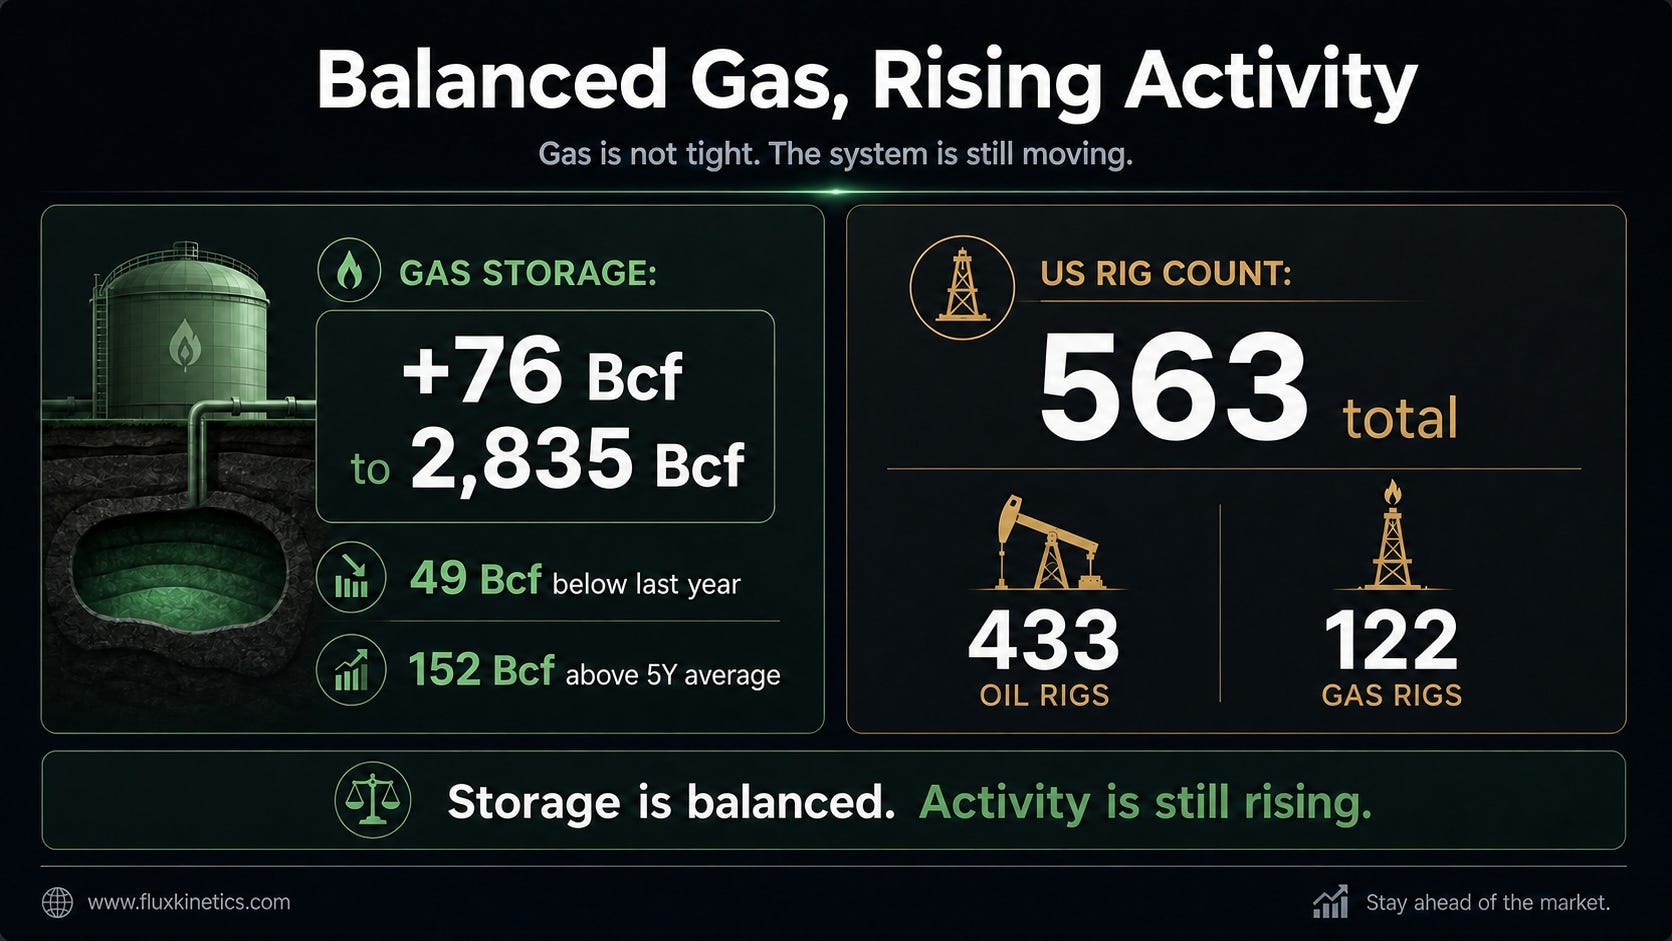
Working gas in storage rose 76 Bcf to 2,835 Bcf. Stocks are now 49 Bcf below last year, but 152 Bcf above the five-year average.
That is balanced. Not tight enough to chase. Not loose enough to ignore.
THE FLUX KINETICS INSIDER VIEW:
The screen will trade weather. The balance sheet is being shaped by exports, power burn, and pipe. Also, winter stock start to fill up…
Projects kept moving
This is the part of the tape I care about most.
Flat price moved fast. Real money moved with it, and not in the same direction.
Azule Energy took final investment decision on a $5.1 billion offshore project, FPSO, in Angola.
U.S. regulators approved construction of the Mountain Valley Southgate pipeline. Baker Hughes data showed the U.S. rig count up again to 563 total rigs, with 433 oil rigs and 122 gas rigs.
Projects are slow while headlines are fast. Operators keep sanctioning new barrels, FERC keeps approving pipe, and rigs keep edging higher…
Capital does not move on rumors.
It moves on belief.
Metals check
Copper held up better than oil and this is why it matters :
the recent pause in copper looks like consolidation, not a top. The structural demand story tied to grid, data centers, and electrification did not disappear because Brent fell ten percent.

If oil is dropping because war risk left the market, while copper stays firm, the market is not pricing a global demand washout. It is pricing the speed of normalization.
THE FLUX KINETICS TRADE:
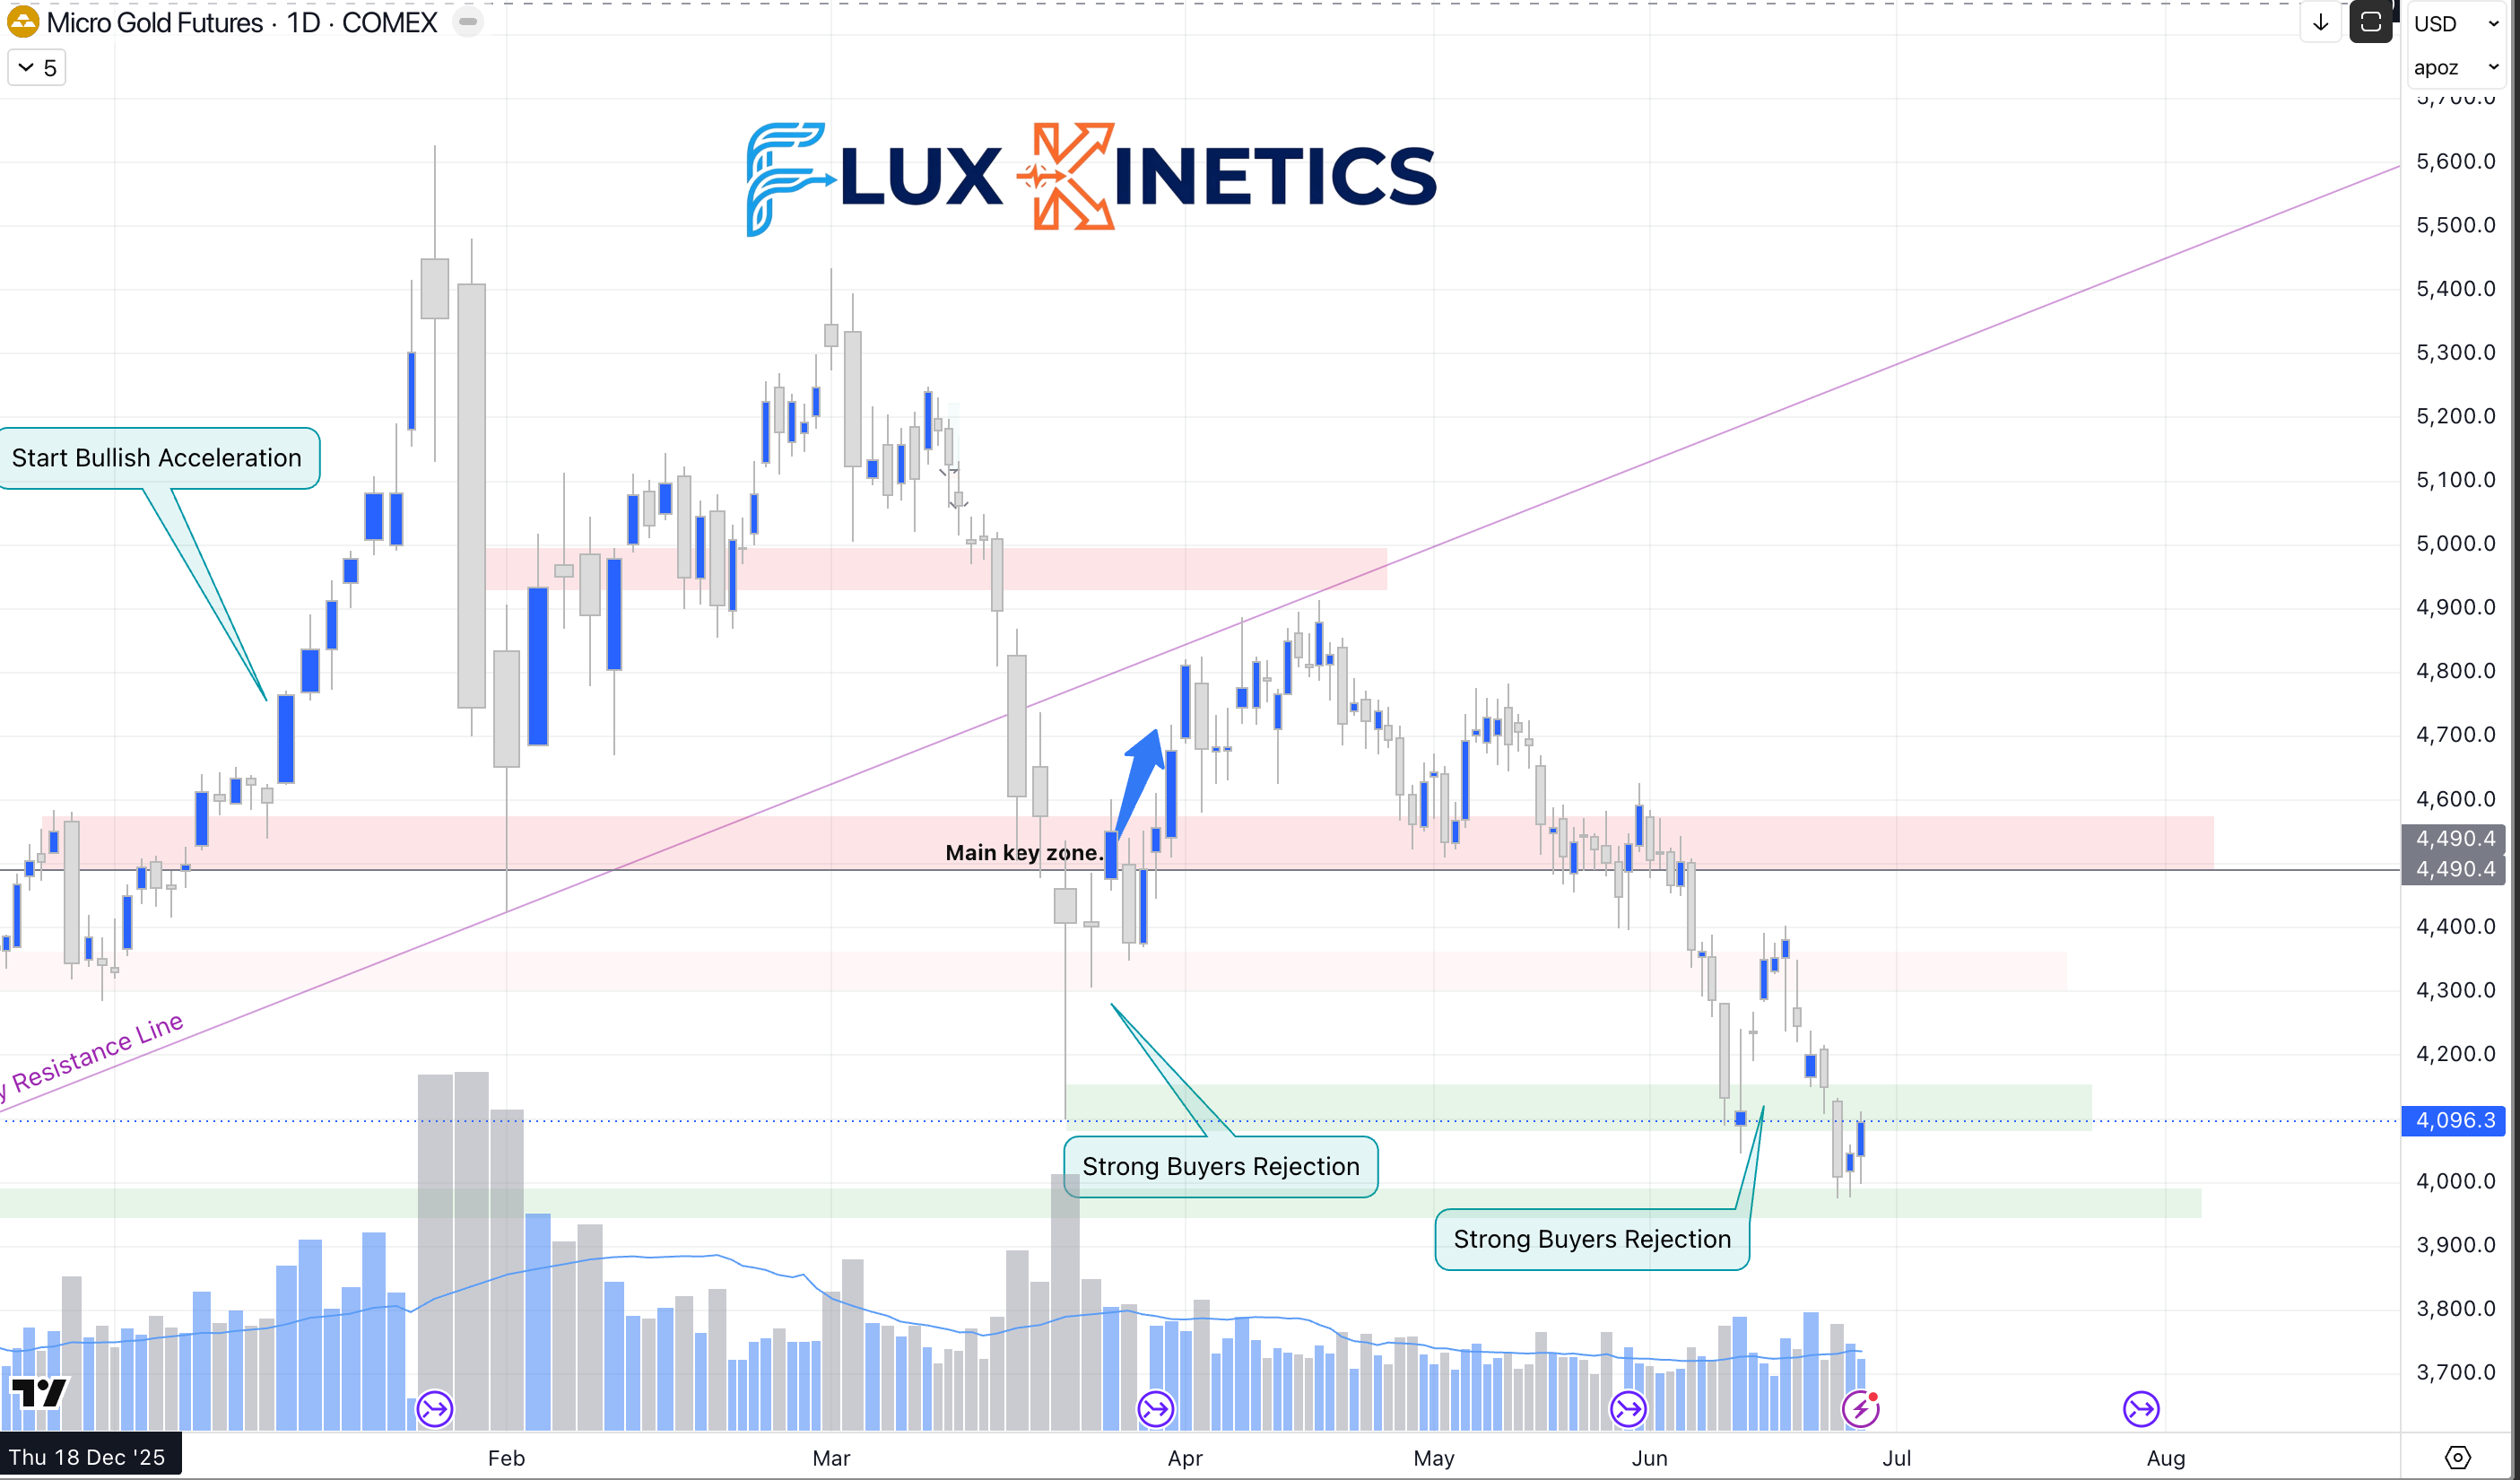
If you entered the Gold setup, congratulations, you are still on the trade. The stop loss has not been touched, and you should now be at break even. If you didn’t enter yet, another option to enter a $4,000 pullback Long which holds, you R:R will be high in this case.
Invalidity under $3,940, as shared in below original trade. Strong dollar with potential FED rate hike, push gold down…but it’s holding about 4k$.
Previous Setup : Potential long entry would be a second pullback to $4,100 which will hold. Stop Loss below $3,940. Take Profit can be targeted as a first level: $4,300, then $4,500.
📬 Never miss a signal
If this is your first time reading Flux Kinetics, every weekly note lands free in your inbox. No noise, no filler, just what actually moved the tape.
Week ahead
Tuesday, July 1: EIA Weekly Petroleum Status Report.
Thursday, July 2: EIA Weekly Natural Gas Storage Report and U.S. June jobs report.
The Close
What I want to see is simple.
If crude keeps drawing with WTI under $70, the screen ran ahead of the data.
If refinery runs roll over and product builds stack up, then this selloff was right to move first.
For now, the read stays the same.
Oil sold the reopening, the physical market softened, but it is not loose.
This is no longer a closure trade. It is a speed of normalization trade.
⚡ One last thing
If this changed how you see the week, send it to one person who needs to see it too. That is how Flux Kinetics grows. Reader by reader, not algorithm by algorithm.
📨 Share • 📬 Subscribe • 💬 Leave a comment
Flux Kinetics - Where Energy Meets Intelligence.
Wassim CHIADLI
This content is for educational purposes only and does not constitute financial, legal, or tax advice. All opinions and analyses are my own, and any actions you take are at your own risk after consulting an appropriate professional.