

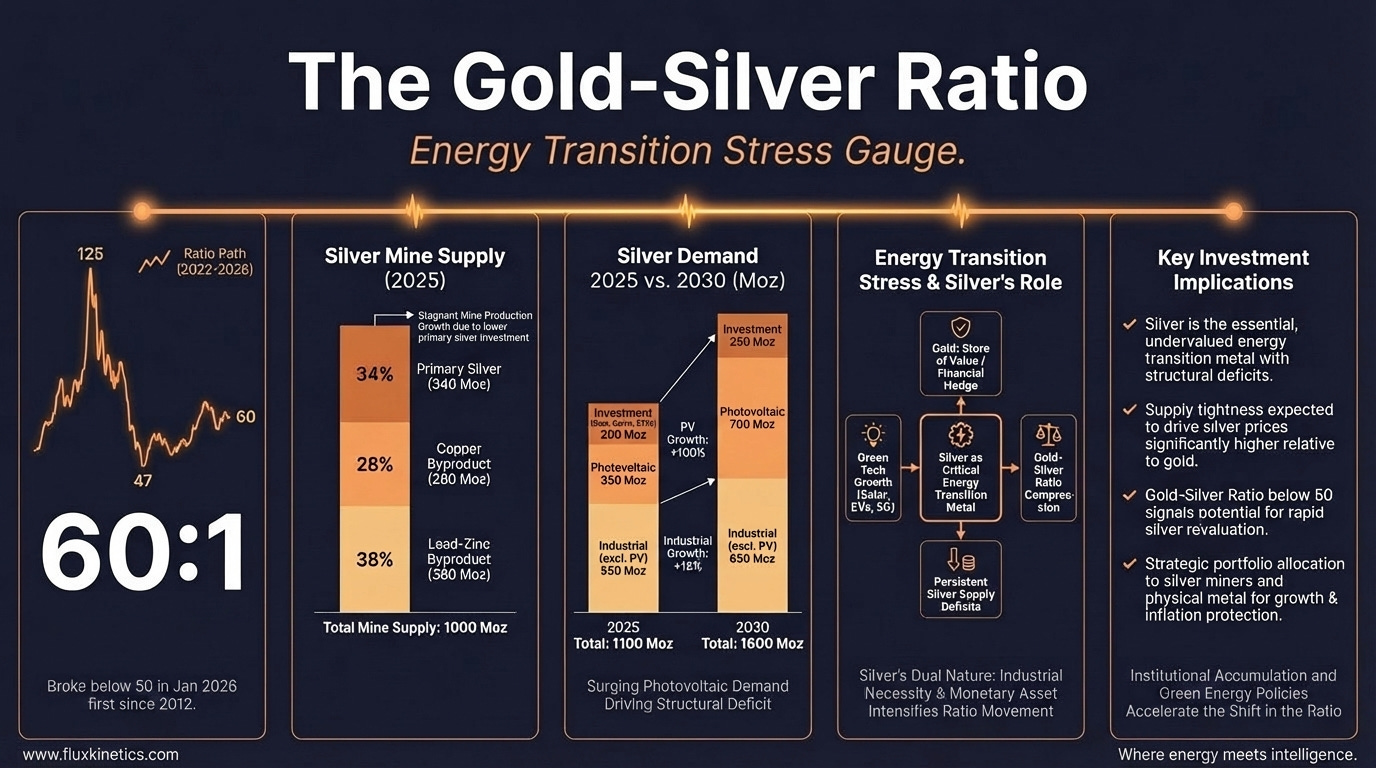
Gold-Silver Ratio as Energy Transition Stress Gauge
Six years of deficit...

Dear Executives, Traders, Investors, and friends
Silver hit $121.64 an ounce in January. That was a 147% gain in twelve months, the strongest annual run since 1979. The gold-to-silver ratio, the oldest spread trade in metals, compressed below 50 for the first time since 2012. It has since settled near 60, with gold around $4,800 and silver around $80. Most desks read this as a catch-up trade. Silver closing a valuation gap with gold.
That reading is incomplete. The ratio is telling you where it breaks.
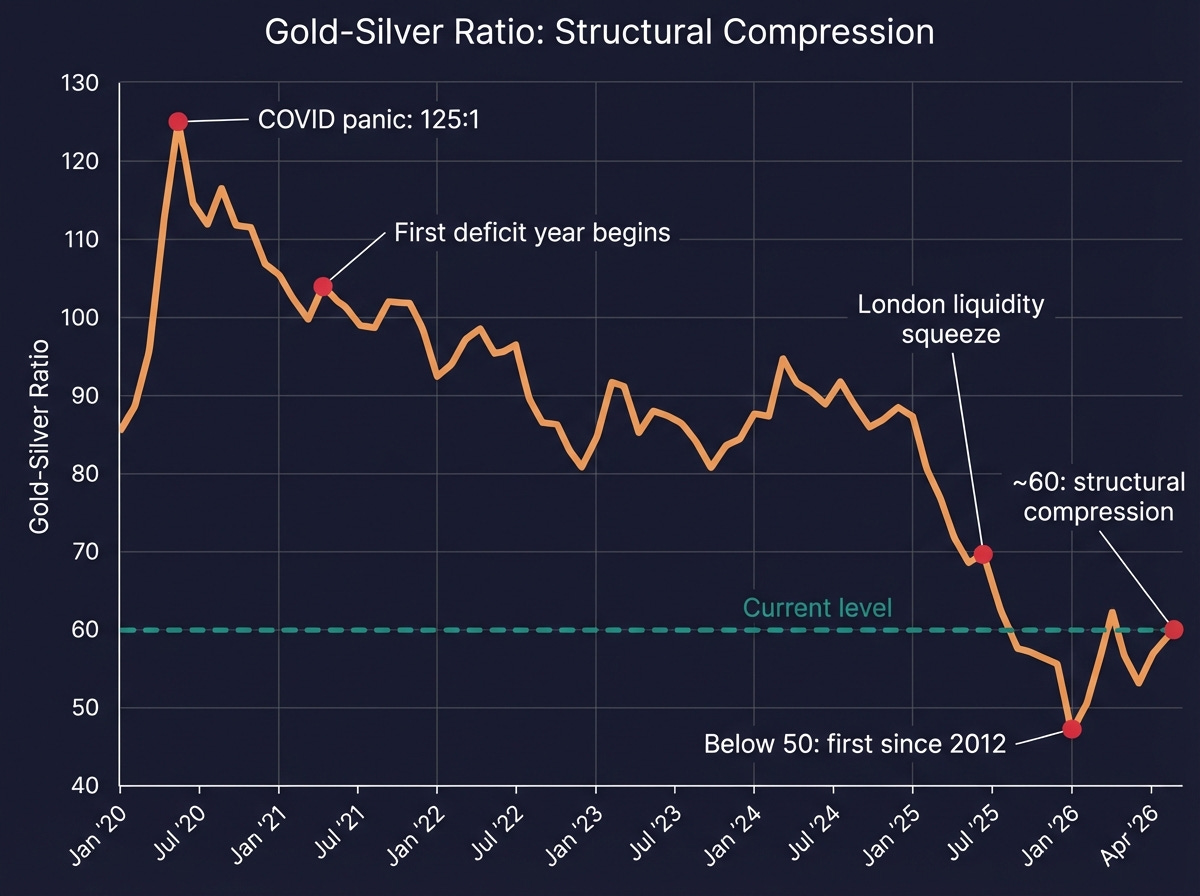
The ratio is no longer just a precious metals indicator. Read against six consecutive years of structural silver deficit, a byproduct supply chain that cannot respond to its own price signal, and a Chinese policy shock about to hit copper smelters, the gold-to-silver ratio has become a real time stress gauge for the physical energy transition itself. The question is not whether silver is cheap relative to gold. The question is whether the industrial economy can source enough of a metal it cannot independently mine.
In this issue:
The Byproduct Trap
Where the Ounces Went
China’s Acid Bottleneck
The Solar Substitution Paradox
What Breaks Next
The Byproduct Trap
About 70 to 75 percent of the world’s silver is not mined from silver mines. It comes out of the ground as a byproduct of copper, lead zinc, and gold operations. This means silver production responds to base metal economics, not silver economics. When copper prices rise, copper miners produce more ore, and more silver falls out. When zinc smelter margins collapse, silver output from those operations contracts. The silver market has no independent supply lever.
This is the structural fact that most ratio analysis ignores.
Per the World Silver Survey 2026, released April 15 by the Silver Institute and Metals Focus, global silver mine production is expected to rise just 1% in 2026 to approximately 820 million ounces. Primary silver mines supply only 28% of that total. The rest is tethered to someone else’s production decision.
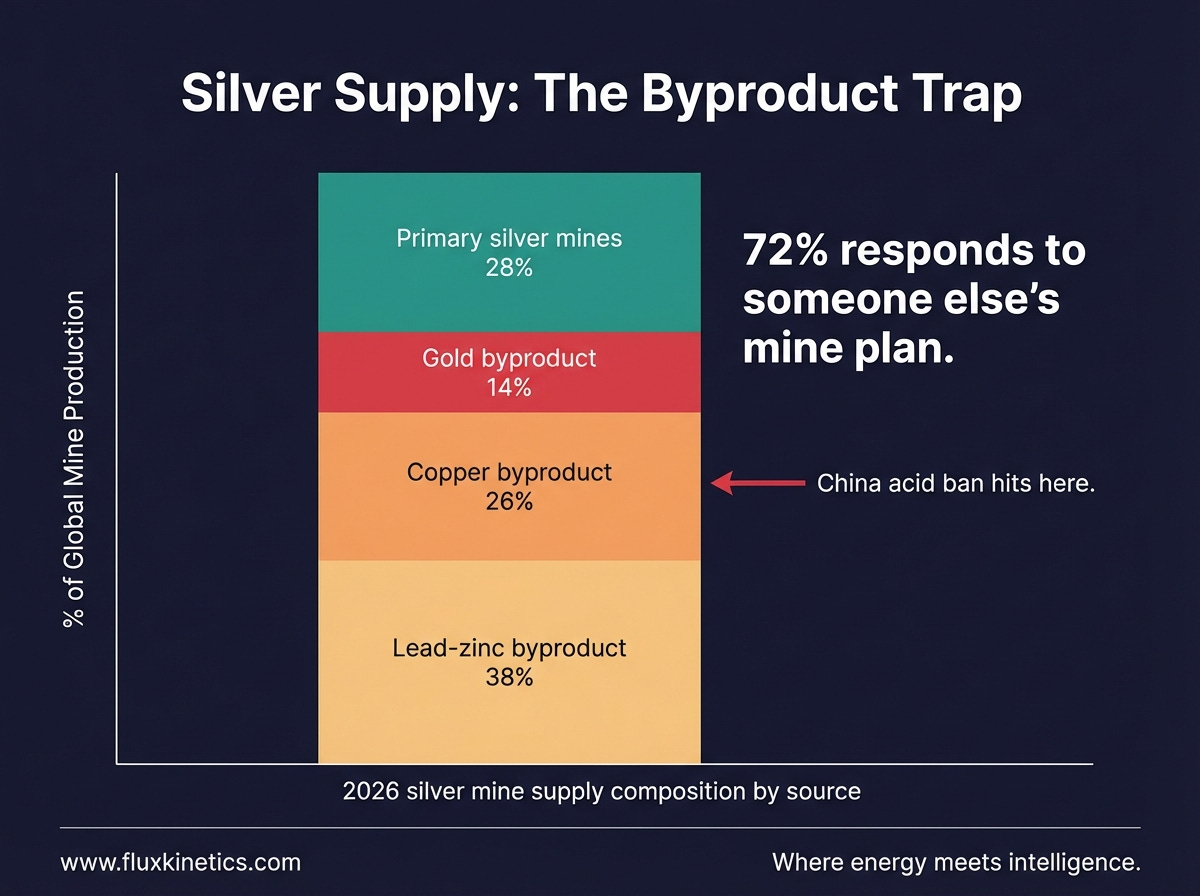
“You cannot mine what you do not control. Silver’s supply curve belongs to copper.”
I have watched this dynamic play out across a dozen commodity cycles. A metal whose supply is a footnote in another metal’s mine plan does not behave like a metal with its own production response. It behaves like a hostage.
Where the Ounces Went
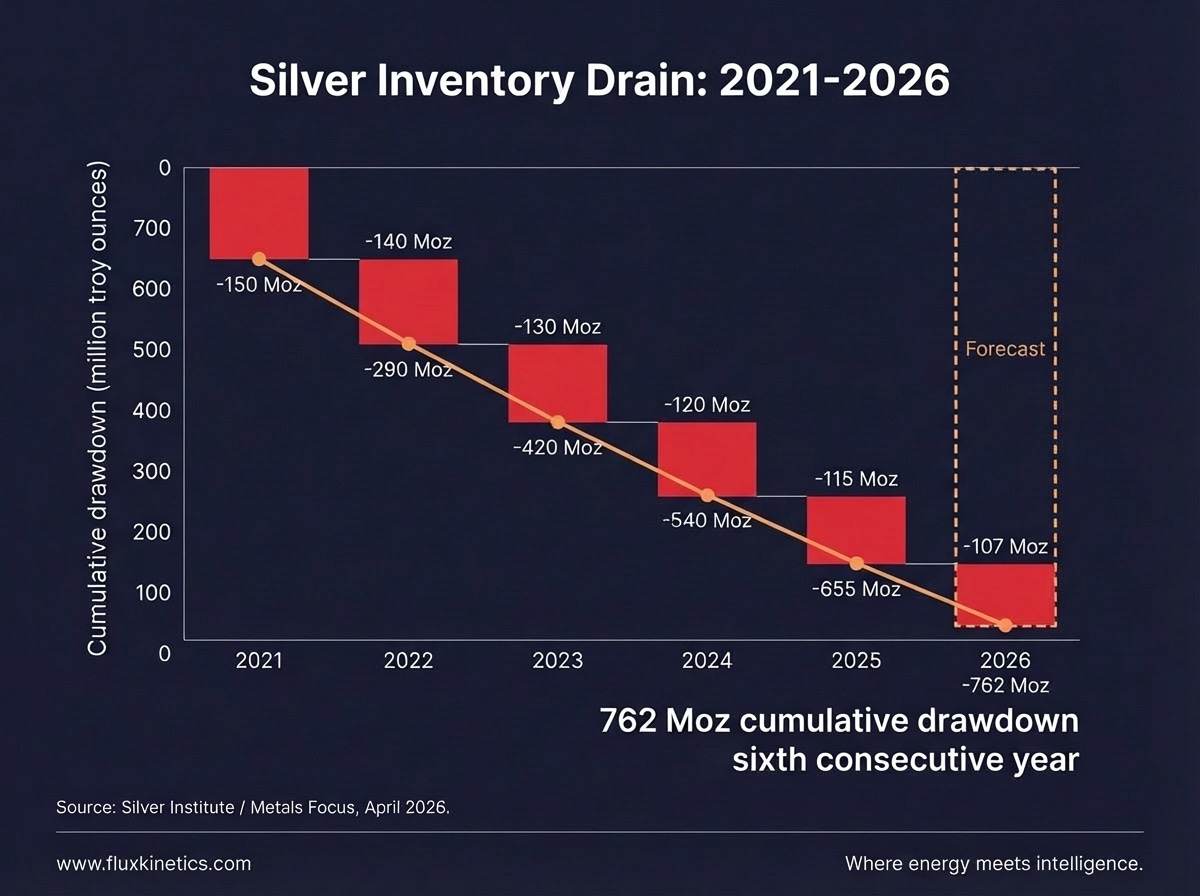
The global silver market has run a structural deficit every year since 2021. The cumulative drawdown from above-ground inventories over that period totals 762 million troy ounces. That number is not a rounding error. It is a systematic depletion of the buffer stock that keeps the physical market liquid.
The 2025 deficit came in at 40.3 million ounces. The 2026 deficit, is projected to widen 15% to 46.3 million ounces. Total demand is actually falling 2% in 2026, driven by weaker industrial and jewelry consumption. Supply in the otherside is falling faster, down an estimated 2%, as producer hedging becomes normal after a spike in late 2025…
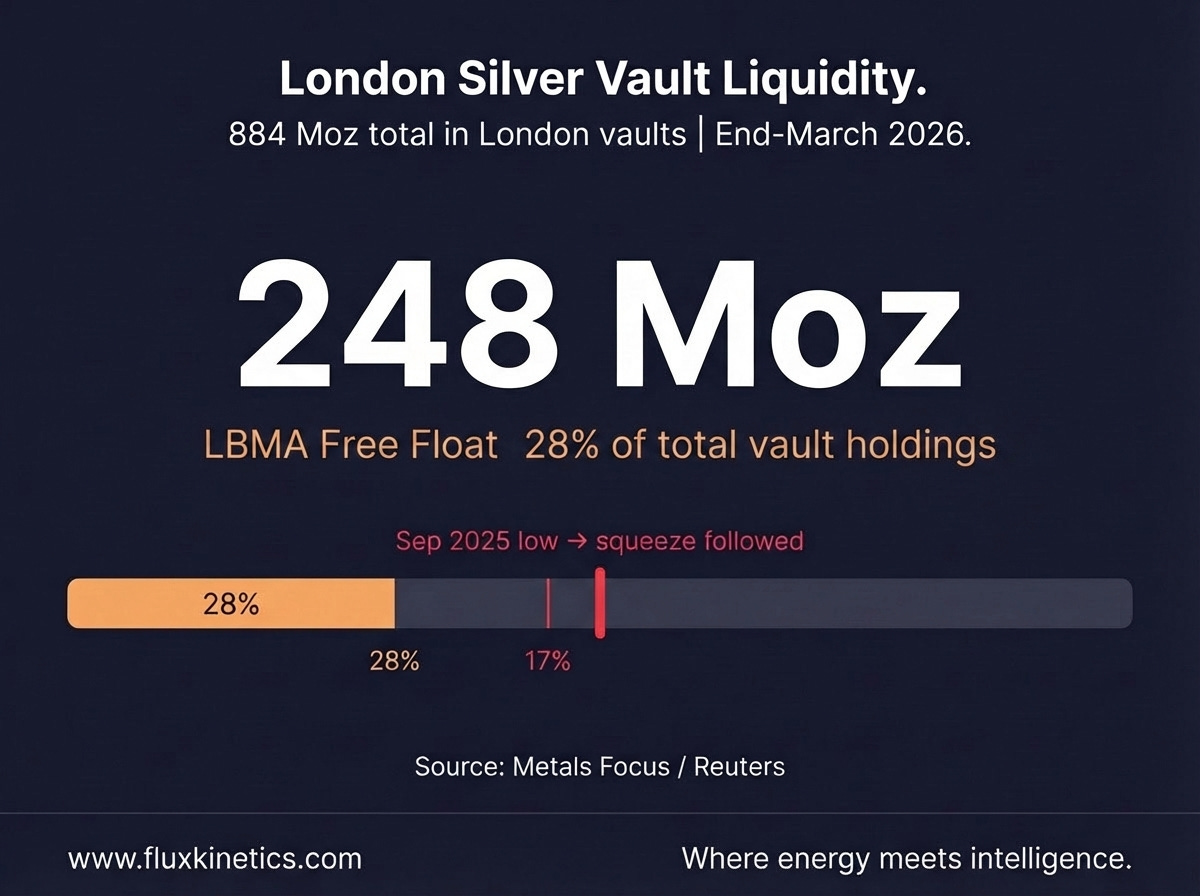
Now look at the numbers in London. LBMA vaults held 884 million ounces at end-March 2026. Only 28% of that, roughly 248 million ounces, was free float, meaning metal not pledged against exchange-traded products. We can see that lease rates have normalized but the conditions for another squeeze remain in place.
That free float figure is the one the market should be watching. In September 2025, the share fell to a historic low of 17%, and the October liquidity squeeze followed within weeks. Silver spiked to $121 by January.
“762 million ounces gone. The vaults are not empty. But the margin of safety is.”
China’s Acid Chokepoint
On April 10, China informed it will halt exports of sulfuric acid starting in May 2026. This is not a silver story on its face. It is a copper smelting story that becomes a silver story because of the byproduct trap.
Sulfuric acid is essential to copper concentrate processing. China is the world’s dominant copper smelter. Per Reuters reporting on April 14, Chinese smelters will likely press ahead with production curbs as the ban removes a key revenue stream, acid sales, that subsidized smelting margins.
Here is the catch: If Chinese copper plant output falls, byproduct silver from those operations drops with it. Copper-origin silver accounts for roughly 25 to 27 percent of global supply. Even a 5 to 10 percent cut in Chinese copper smelting output would shave millions of ounces off global silver production in a market already running a 46-million-ounce deficit. Those are ounces that do not exist twice.
Business Insider went underground in Bolivia to show why silver's supply can't keep up with the energy transition's appetite:
This is where the gold-silver ratio becomes operationally meaningful. Gold supply is not tethered to copper smelters. Gold is mined from dedicated operations, recycled from jewelry, and stockpiled by central banks. The current forecasts shows central banks will buy approximately 850 tonnes of gold in 2026, with Poland alone taking 20 tonnes in February and the People’s Bank of China adding to reserves for 16 straight months.
Gold supply and demand exist in their own orbit.
Silver does not get that luxury.
When the ratio compresses, it reflects silver gaining ground on gold. When that compression occurs during a sixth consecutive supply deficit, a vault drawdown of three-quarters of a billion ounces and upcoming smelter problem, the ratio is not measuring relative valuation. It’s measuring how hard the physical economy is pulling on a metal it cannot produce fast enough…
“Strip out solar and the deficit still holds. That is the number the substitution bulls do not want on the record.”
The Solar Substitution Paradox
A comfortable rebuttal to this thesis runs as follows: solar manufacturers are replacing silver with copper, so industrial demand is falling, and the deficit will resolve itself.
The numbers partially support that story. Silver demand from the photovoltaic sector fell 6% in 2025 to 186.6 million ounces. It is forecast to fall another 19% in 2026 to roughly 151 million ounces. LONGi Green Energy announced plans in January for mass production of copper-based metallization between April and June 2026. This switch could save the solar industry $15 billion annually at 500 gigawatts of production.
🔁 Found this useful?
Flux Kinetics runs on word of mouth. If this note sharpened how you see the energy transition costs without a line item for silver, one forward to the right person is worth more than any algorithm.
📨 Share this issue
Coin and bar investment demand is forecast to rise 18 to 20 percent in 2026. Western physical buying is recovering after three weak years. Indian investment demand remains strong. Every ounce that solar thrifting releases is claimed by another segment of the market.
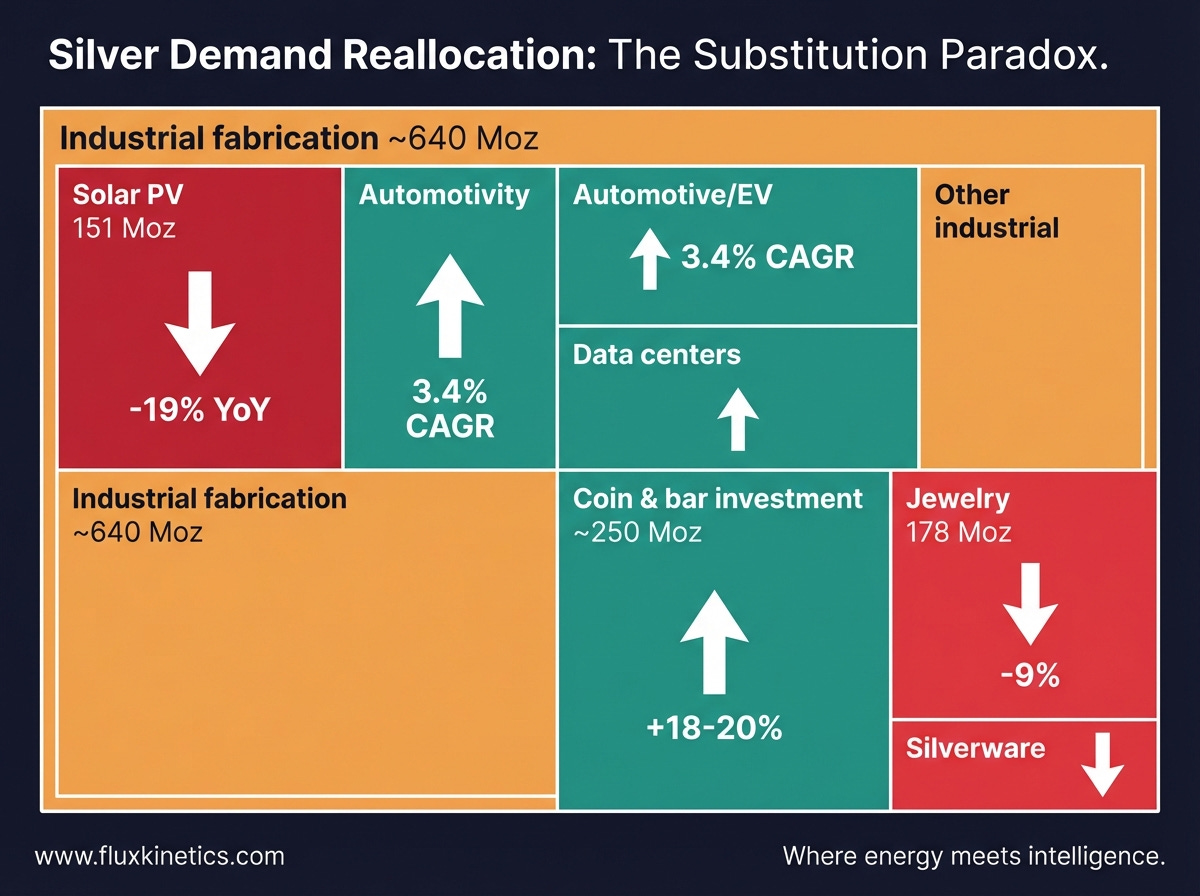
The deficit does not close. It reshuffles.
The substitution itself is not clean. The move toward copper‑based plating and mixed silver‑copper pastes. Copper has lower electrical conductivity than silver, and certain cell architectures, particularly TOPCon, are less compatible with alternatives due to high-temperature fabrication. Reliability data from LONGi’s mass production run, expected in the second quarter of 2026, will be the real test. If yield or durability falls short, solar silver demand could stabilise or re accelerate.
I have seen substitution narratives before. Usually, the timeline from lab announcement to reliable mass production at scale is longer than the market prices in… Every time.
In case you’ve missed my previous article about UAE exit from OPEC:

What Breaks Next
If China’s sulfuric acid export ban extends through the third quarter of 2026 and copper smelter output falls materially, the 2026 silver deficit could widen beyond the current 46.3-million-ounce forecast. On that trajectory, London free float drops below 200 million ounces, and the conditions for another liquidity squeeze reassemble. This time with less buffer than October 2025.
If that happens, the gold-silver ratio will compress again, from a base of 60, not 88.
Smart money is already positioning for tight supply chains. BHP closed a $4.3 billion silver streaming deal with Wheaton Precious Metals on the Antamina mine in Peru on April 1. That is the largest streaming transaction by upfront payment in history. BHP is monetizing byproduct silver to retain copper exposure. Wheaton is locking in 67.5% of Antamina’s silver output. That is not a speculative bet. That is a physical supply chain play by two companies that model metal flows for a living.
The kill condition is clear: if copper metallization succeeds at scale in solar PV without reliability penalties, and if China lifts the acid ban quickly, the deficit could narrow enough to relieve vault pressure and widen the ratio back toward 70 to 80. That would signal the transition’s material stress is easing. Watch LONGi’s second-quarter production data and China’s acid policy through year-end.
As we covered in our previous analysis of energy transition metals bottlenecks, the physical supply chain rarely cooperates with the deployment timeline the models assume. The gold-silver ratio, in this context, is simply the market’s way of keeping score.
Flux Kinetics Diagnostic: How to Position ?
Track the LBMA free float monthly. If the non-ETP share drops below 25% of total vault holdings, squeeze risk is elevated. The September 2025 low was 17%. March 2026 reads 28%.
Set an alert for LBMA monthly vault data releases
Cross-reference with COMEX registered silver inventory trends
Monitor China’s sulfuric acid policy through Q3 2026. Duration matters more than the ban itself. A reversal before August eases the chokepoint. Extension through December tightens it.
Follow Reuters and S&P Global Metals coverage for smelter output data
Watch Chinese copper cathode production figures as a proxy
Watch LONGi’s Q2 2026 copper metallization results. Yield and reliability data from mass production will determine whether solar substitution is real or aspirational.
LONGi earnings call and technical disclosures, expected Q3 2026
Track silver loading per watt data from BloombergNEF solar supply chain reports
Use the ratio as a regime indicator, not a trade signal. Below 55: physical stress intensifying. 55 to 65: structural tension, manageable. Above 70: stress easing or industrial demand weakening. The direction of the ratio matters more than the level.
Compare ratio moves against EV production data, grid interconnection queue length, and data centers power procurement
Map silver exposure in energy transition portfolios. Most clean energy funds have zero direct silver exposure. The streaming and royalty companies, Wheaton, Franco-Nevada, Royal Gold, are the transmission mechanism.
Review top holdings in transition-themed ETFs for silver supply chain exposure
Wheaton’s Antamina stream now makes it the single largest leveraged play on byproduct silver tightness. The gold-silver ratio at 60 is not a valuation anomaly. It is the metals market pricing what the energy transition’s spreadsheets leave out.
If the acid ban holds and substitution stalls, the ratio compresses further in the second half of 2026. And the next time it touches 50, the vaults will have less to give.
You are now tracking the signal most energy transition models ignore. That is an edge.
⚡ One last thing
If this changed how you see the week, send it to one person who needs to see it too. That is how Flux Kinetics grows. Reader by reader, not algorithm by algorithm.
📨 Share • 📬 Subscribe • 💬 Leave a comment
Flux Kinetics - Where Energy Meets Intelligence.
Wassim CHIADLI
This content is for educational purposes only and does not constitute financial, legal, or tax advice. All opinions and analyses are my own, and any actions you take are at your own risk after consulting an appropriate professional.
I read this a little differently, based on what I’ve seen over the years building and scaling products.
The gold to silver ratio is not just about metals. It is a signal. Gold represents stored value. Silver represents usage and expansion. When the world shifts into building mode like energy transition, the demand moves toward what is actually used.
That part makes sense.
But here is where I focus. The real winners are rarely the raw materials alone. It is the infrastructure built around them. I have seen this pattern repeat for decades. The product gets attention, but the system that captures behavior around it is where the long term value sits.
So when I read this, I do not just see silver rising with energy demand. I see a broader shift toward assets tied to real world activity.
That is exactly how I look at data.
Digital data is like gold. Established, widely understood, already priced in.
Real world behavioral data is like silver. Increasingly necessary, directly tied to how the next economy actually functions.
The takeaway is simple.
Transitions reward what becomes necessary, not what already exists.
That is where I place my bets.
Modern civilization has become dependent on materials most people never think about until supply chains tighten. Beyond the readily visible, the world moves at the pace of geology, permitting, refining, and transport logistics. In the middle of this, silver sits at the intersection of monetary psychology and industrial necessity at the same time. That combination creates a very different dynamic than a purely industrial commodity. The transition itself may be exposing how fragile just-in-time global systems become when multiple strategic demands converge on the same finite materials.