

Gold at $4,800: Buy the Dip or Bail Out?
Your tactical guide to the $4,500 make-or-break level.

Macro Drivers: Gold’s parabolic run to $5,600 was fueled by a perfect storm of inflation fears and institutional instability. The return of aggressive US tariff policies sparked renewed inflation concerns, while the unprecedented crisis surrounding Fed Chair Powell’s independence rattled global confidence in the dollar. This, combined with escalating tensions in the Middle East and sustained central bank buying, drove investors aggressively toward safe haven assets, sending bullion into price discovery mode before the recent corrective snapback.
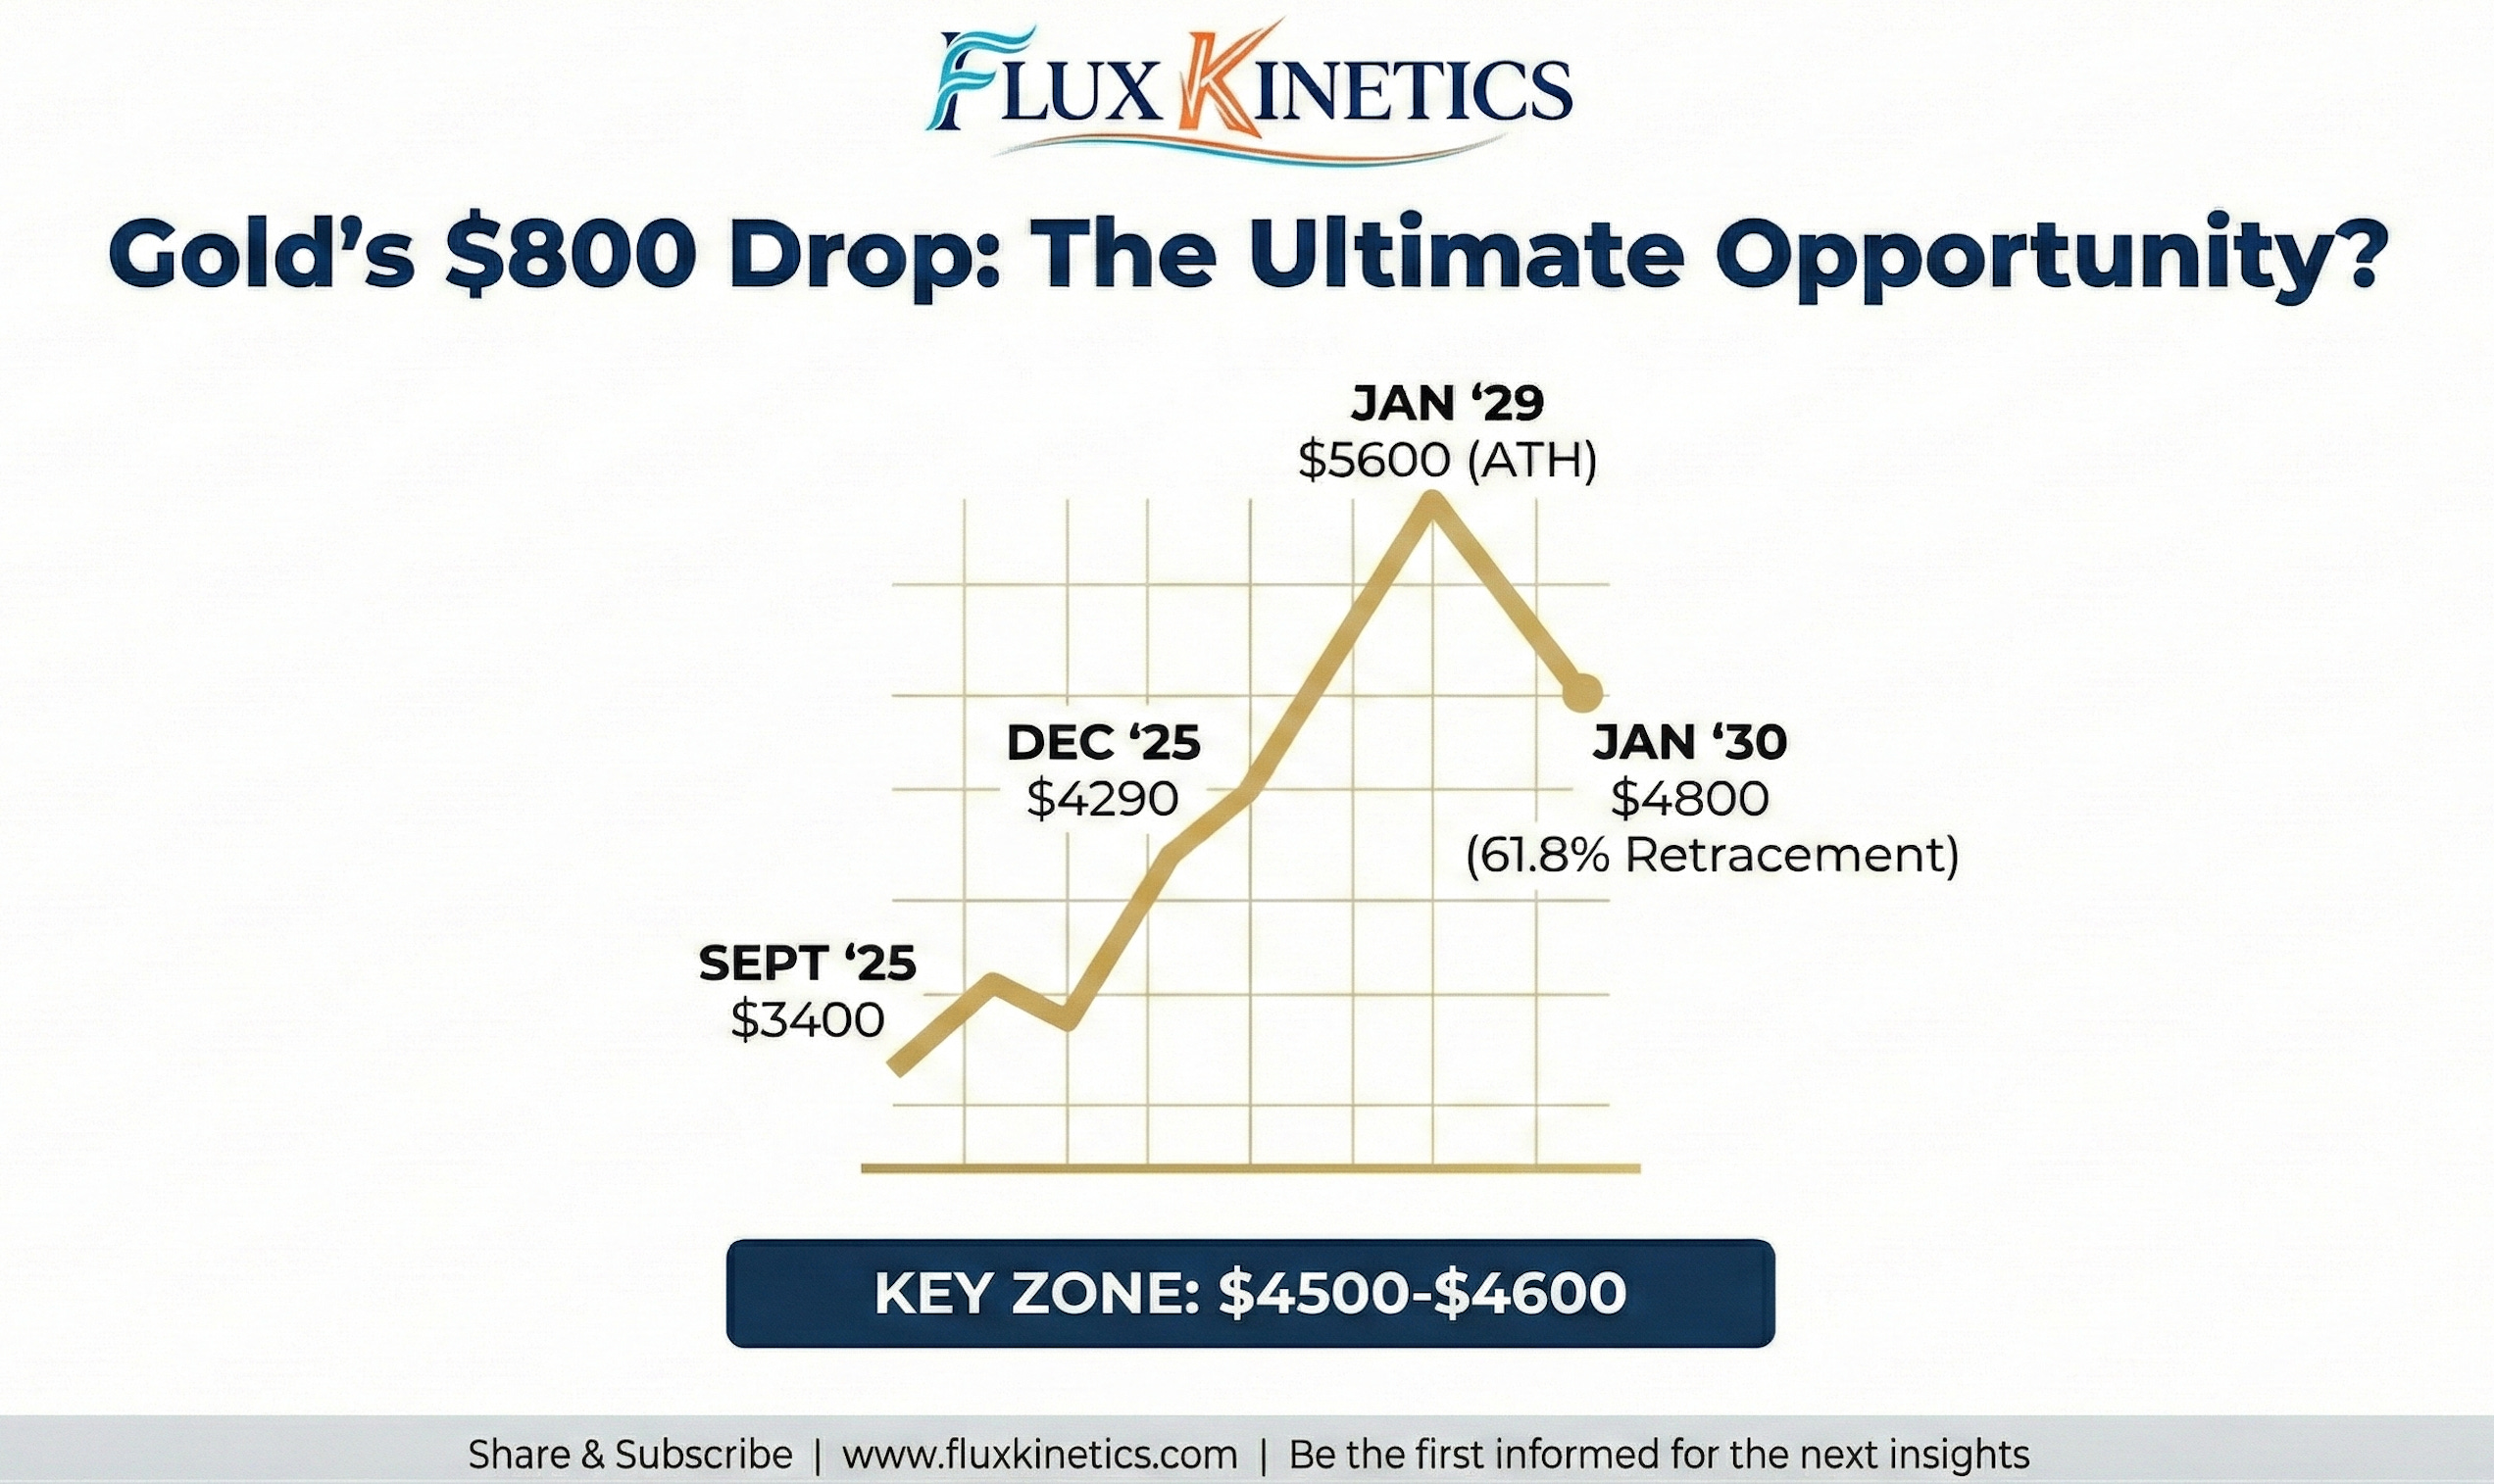
Technical Analysis: Gold has been in an uptrend since September 2025, starting from a base of $3,400. Momentum accelerated after the breakout above the $3,600 resistance, reaching $4,300 before pulling back to $3,900.
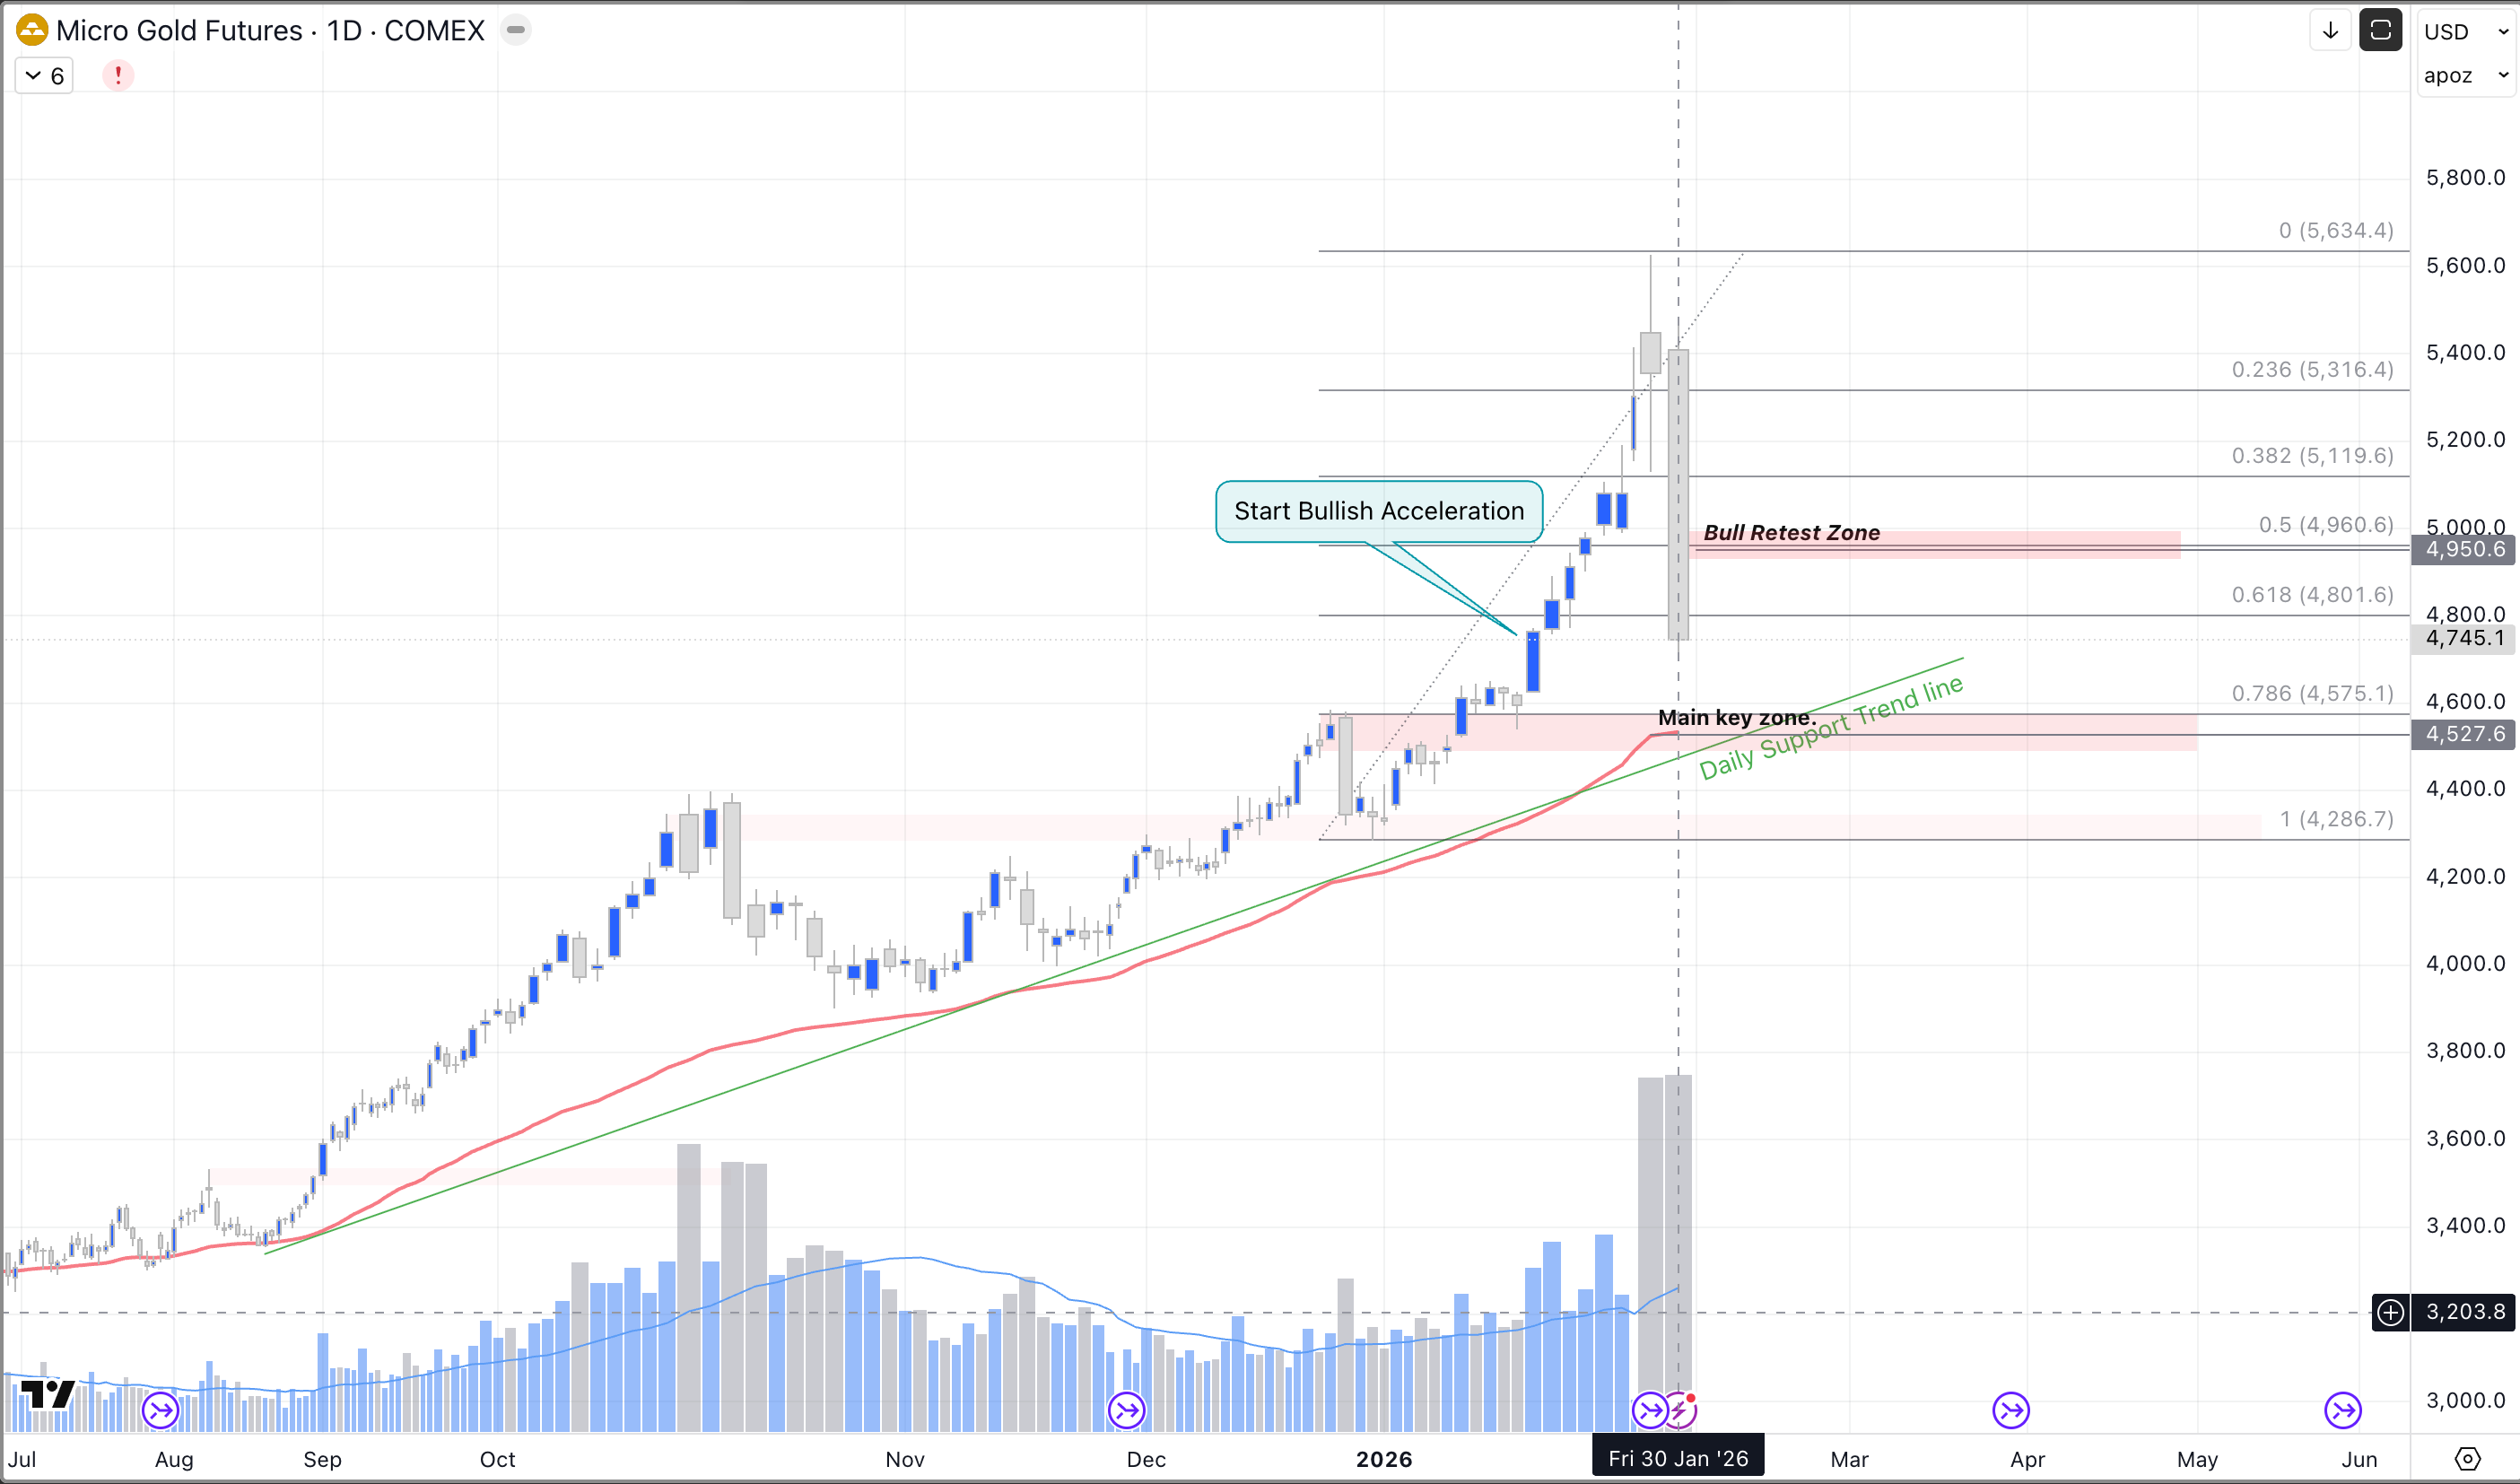
Recently, the price revisited the major resistance level at $4,600, triggering a bullish acceleration that topped out at $5,600 on Thursday, January 29. A sharp sell-off began later that same day and intensified the following day, Friday, January 30, 2026.The Friday close was $4,800, representing a 61.8% Fibonacci retracement of the bullish move that began on December 31, 2025, at $4,290.
Currently, we are monitoring two main areas. The critical Main key zone is between $4,500 and $4,600, which coincides with both the 50-day Moving Average and the daily trendline support. This is a crucial “test zone” for re-entry. However, caution is required to see if bearish pressure pushes the price down for a second test of this level.
Sunday 1st February 26 prior Futures Market opening
Action Plan:
If I’m currently holding a long position: I will watch the key support zone ($4,500–$4,600).
If price breaks down below this zone, I consider selling to lock in profits and look to re-enter at the next critical zone, as the mid-term uptrend remains valid.
If price breaks above the immediate Bull Retest zone, I consider reducing my position size to secure partial profits.
If ‘m not holding a position:
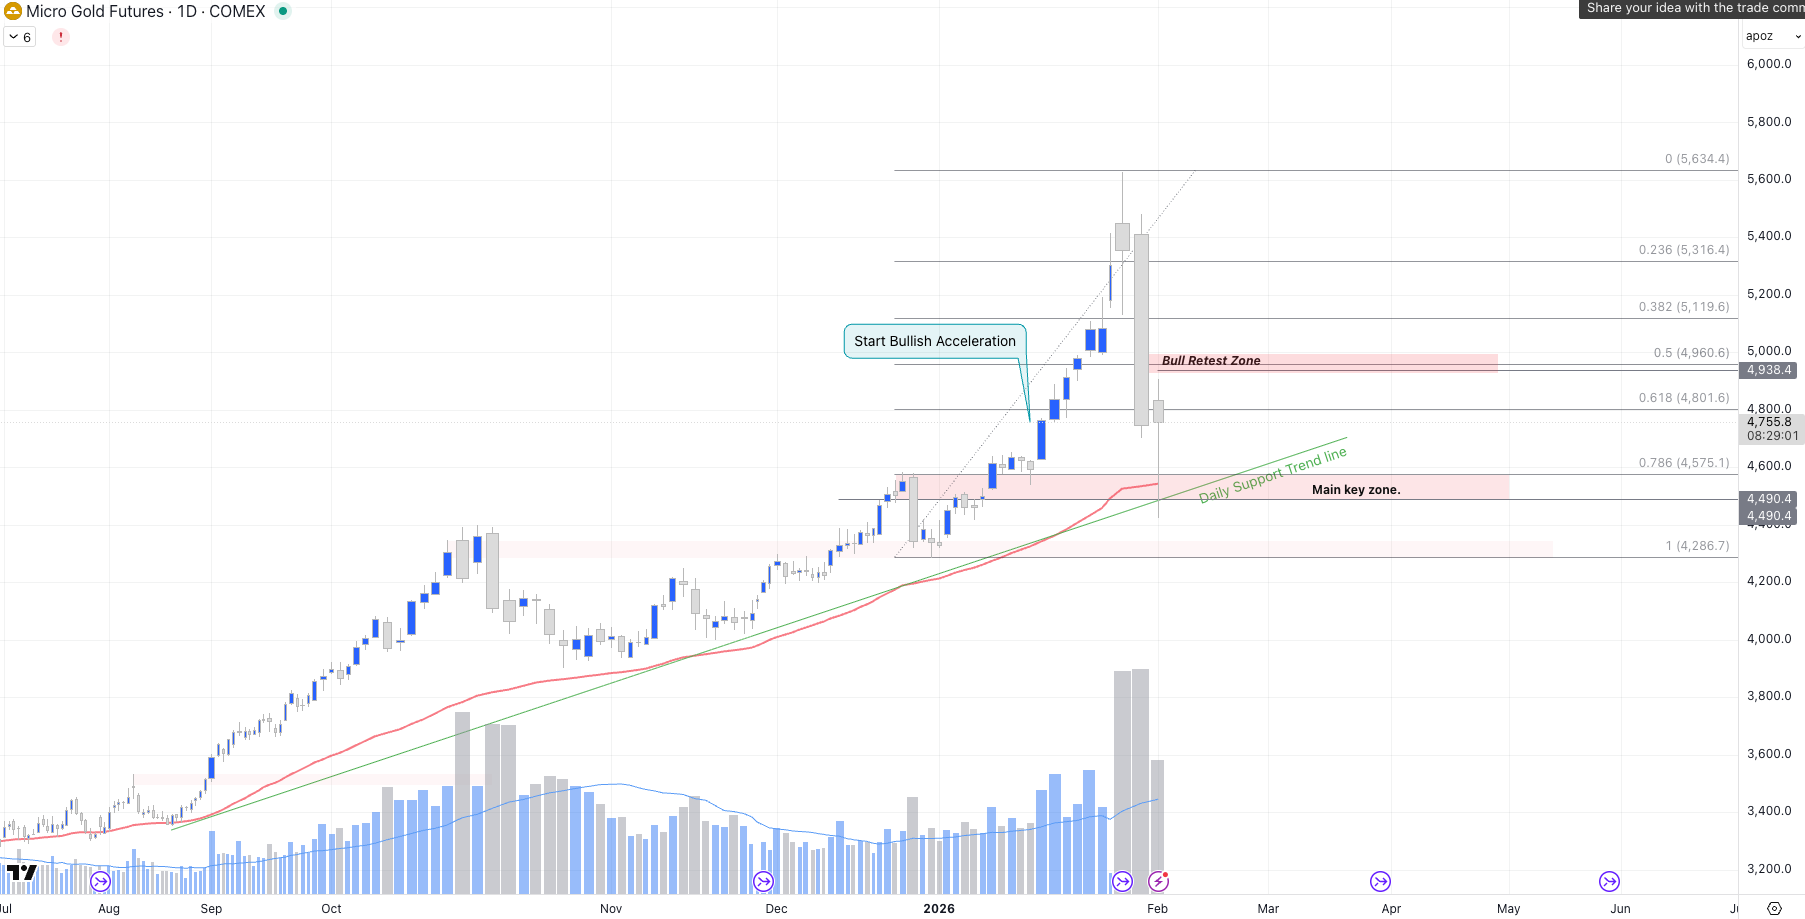
I will wait for the key zone to be tested again to see if support holds above $4,490.
Alternatively, I will wait for a breakout above the next Bull Retest zone, targeting the previous All-Time High (ATH) for a short-term investment plan.
Summary: We are seeing a strong short-term correction within a broader mid-to-long-term uptrend.
Monday 2nd February 26, 1h prior NYSE Stock market opening
Week Ahead: For the next 7 days, volatility will hinge on Friday’s Non-Farm Payrolls (NFP) report. A strong labor market could force the Fed to maintain a hawkish stance, potentially deepening the gold correction. Both Traders and Investors must also watch ISM Services data and any fresh headlines regarding the incoming Fed Chair nominee, Kevin Warsh.
If you found this analysis valuable, a share with your network would be greatly appreciated to support my analysis.
Most importantly, please subscribe to Flux Kinetics to not miss my next analysis.
Flux Kinetics - Where energy meets intelligence,
Wassim C.

This content is for educational purposes only and does not constitute financial, legal, or tax advice. All opinions and analyses are my own, and any actions you take are at your own risk after consulting an appropriate professional.
Professional insights thanks