

Crude Rose. Diesel Broke Free.
Inventories tightened where the barrel mattered most.

Dear Executives, Traders, Investors, and Friends
The barrel that defined the week was not crude. It was diesel. Russia stopped exporting diesel until July 31, and then the main diesel futures contract in New York jumped 11.6% on July 8 to $154.71 a barrel, the biggest one-day rise in four years.
Crude prices also moved up, but the bigger and faster price change happened in the fuels coming out of the refinery, not in crude itself.
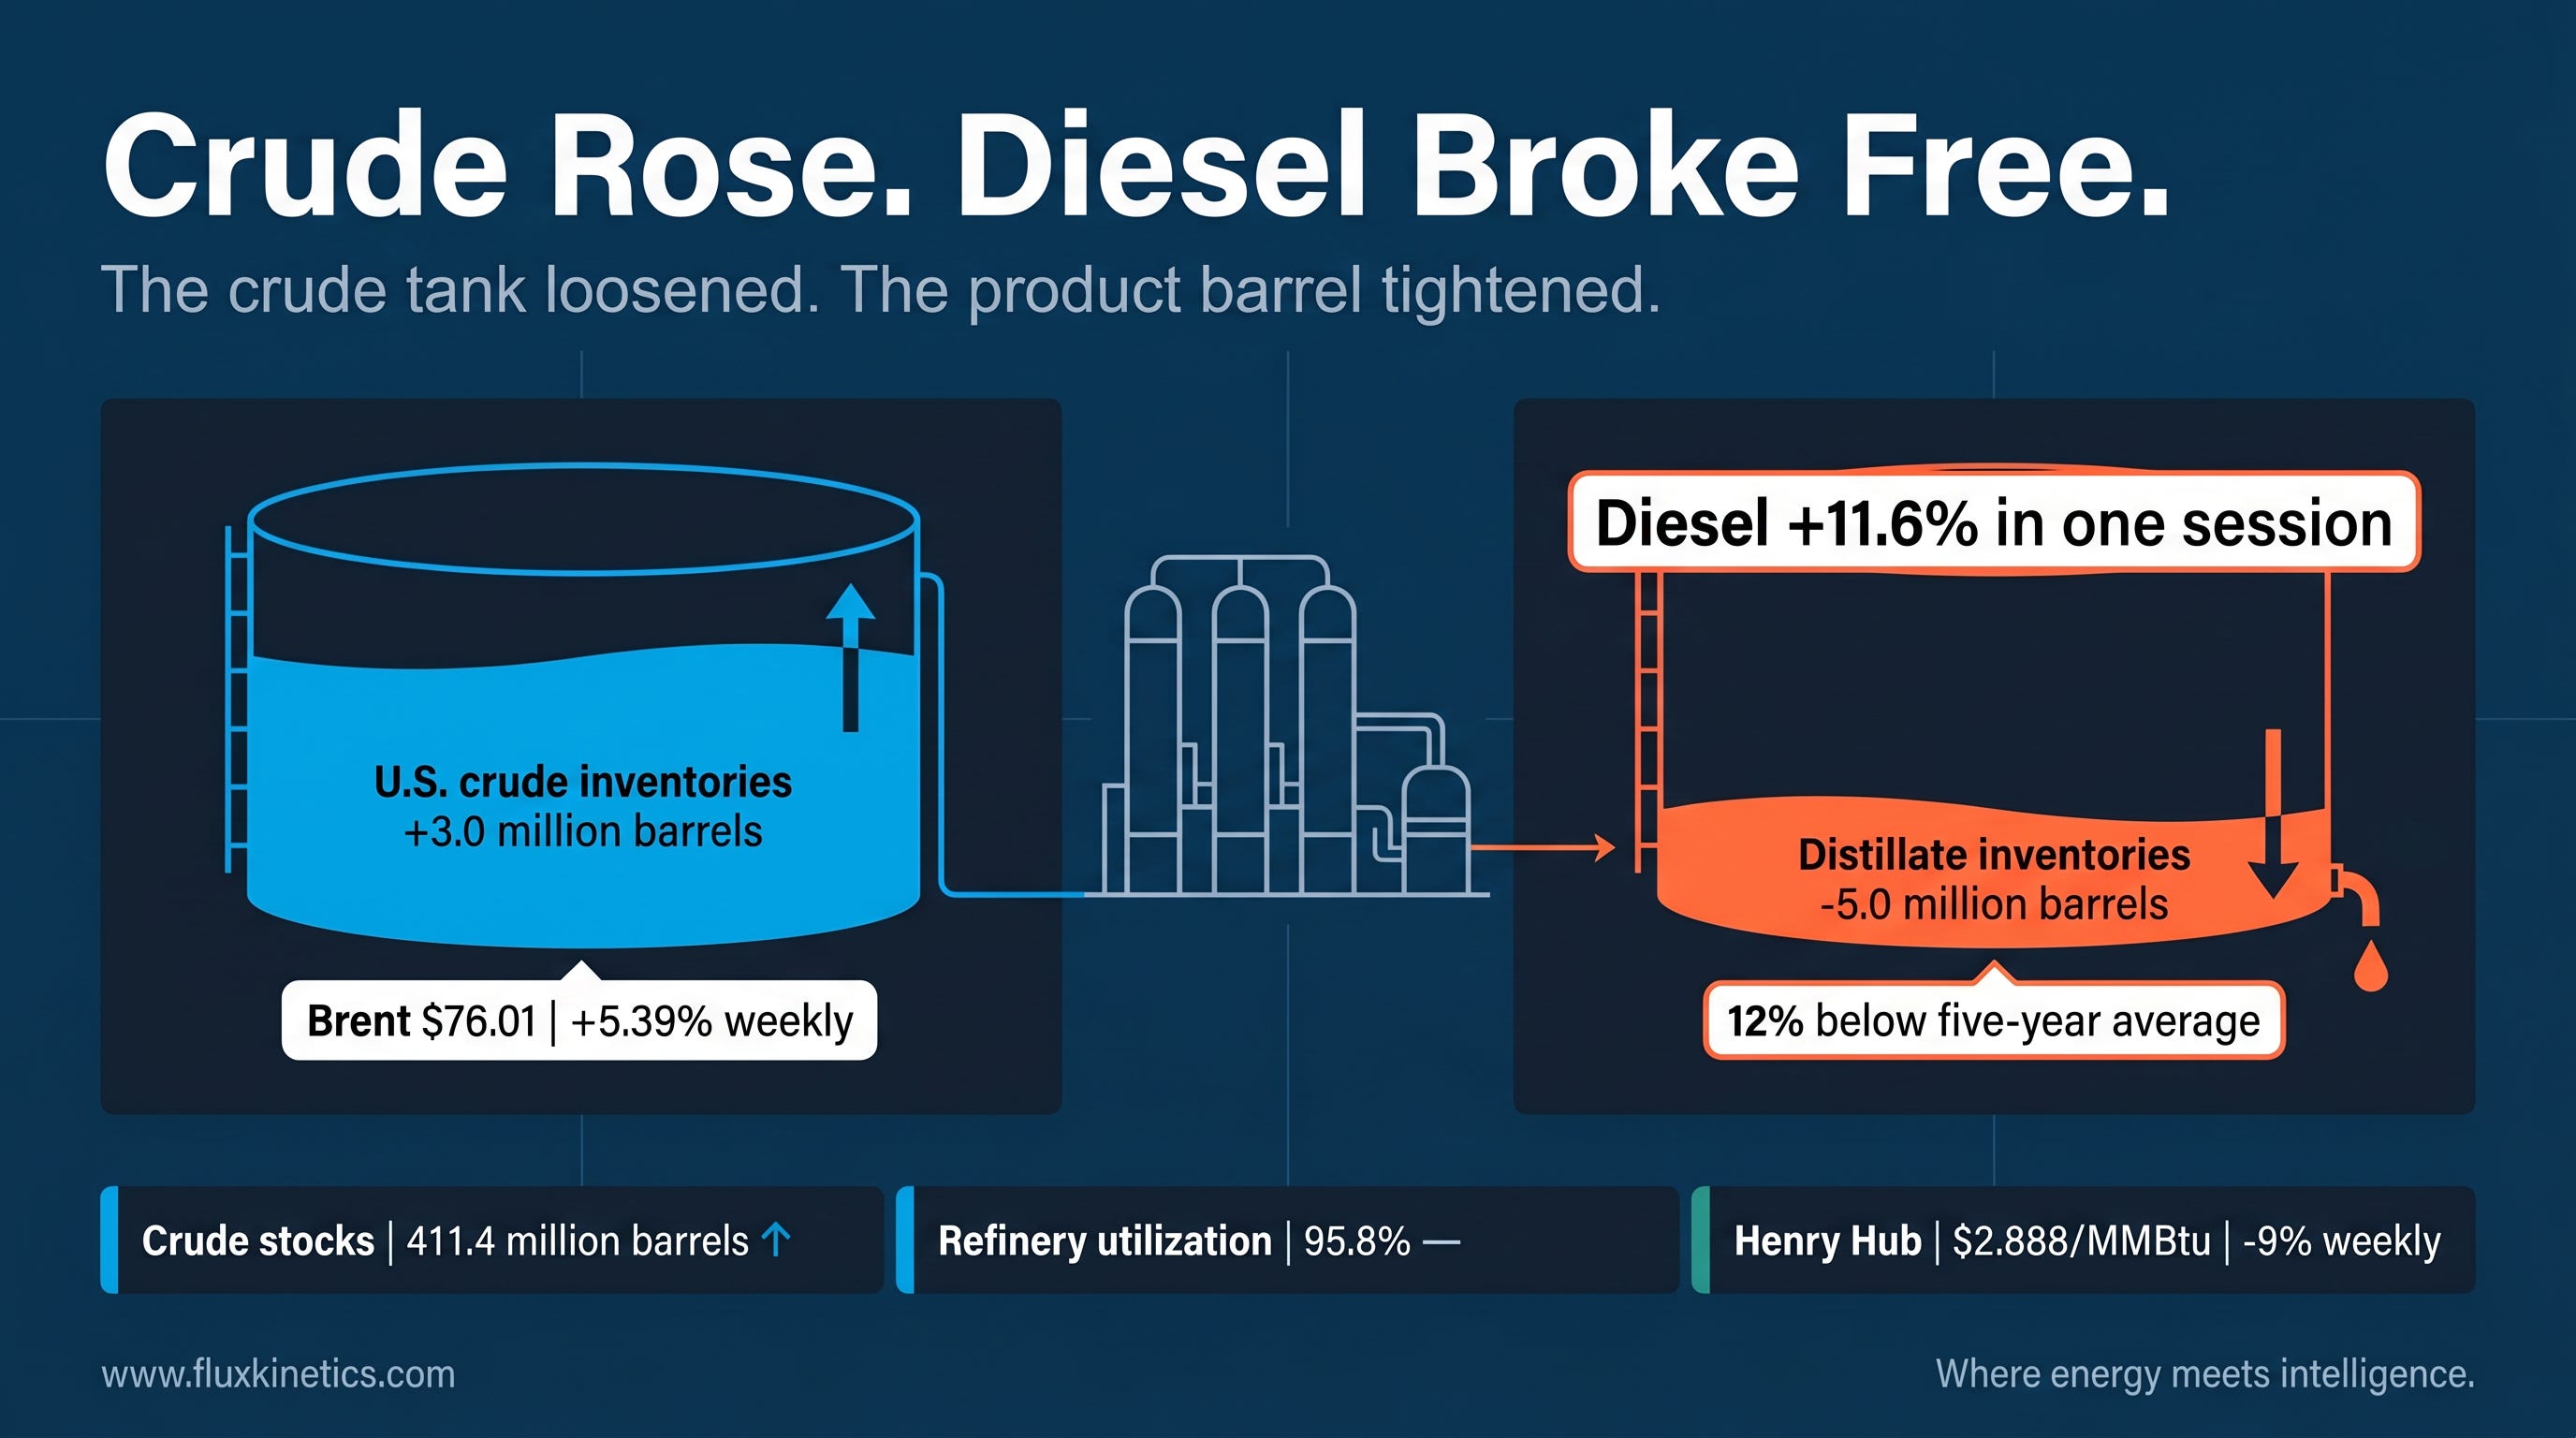
Traders started the week worried mainly about crude supply problems and tanker movements. The U.S. inventory data then showed something more specific. Commercial crude stocks built by 3.0 million barrels, while gasoline drew 1.9 million and distillate collapsed by 5.0 million.
This means the market is really trading two different oil stories at once, not one single balance. Brent crude rose 5.39% during the week, but the stronger message came from the diesel and product market, where stocks were already 12% below their five-year average even before exports were cut
The shortage moved downstream.
Brief Contents
The product barrel
Gas splits in two
Power pulls the metals
Reserves absorb the shock
Week Ahead
The Product Barrel
Brent settled at $76.01 on July 10, up 5.39% for the week. WTI finished at $71.41, up 3.96%. Those price gains first looked like a general crude shortage, until the EIA data showed what was actually happening in storage.
Commercial crude inventories rose 3.0 million barrels to 411.4 million in the week ended July 3. Refineries ran hard, processing about 17.0 million barrels a day and operating at almost 96% of capacity. At that pace, refineries should have reduced crude stocks, but instead imports rose by 351,000 barrels a day to 5.6 million, keeping tanks filled.
The crude build mainly reflected short-term weather effects. The drop in fuel stocks reflected a deeper market cycle.
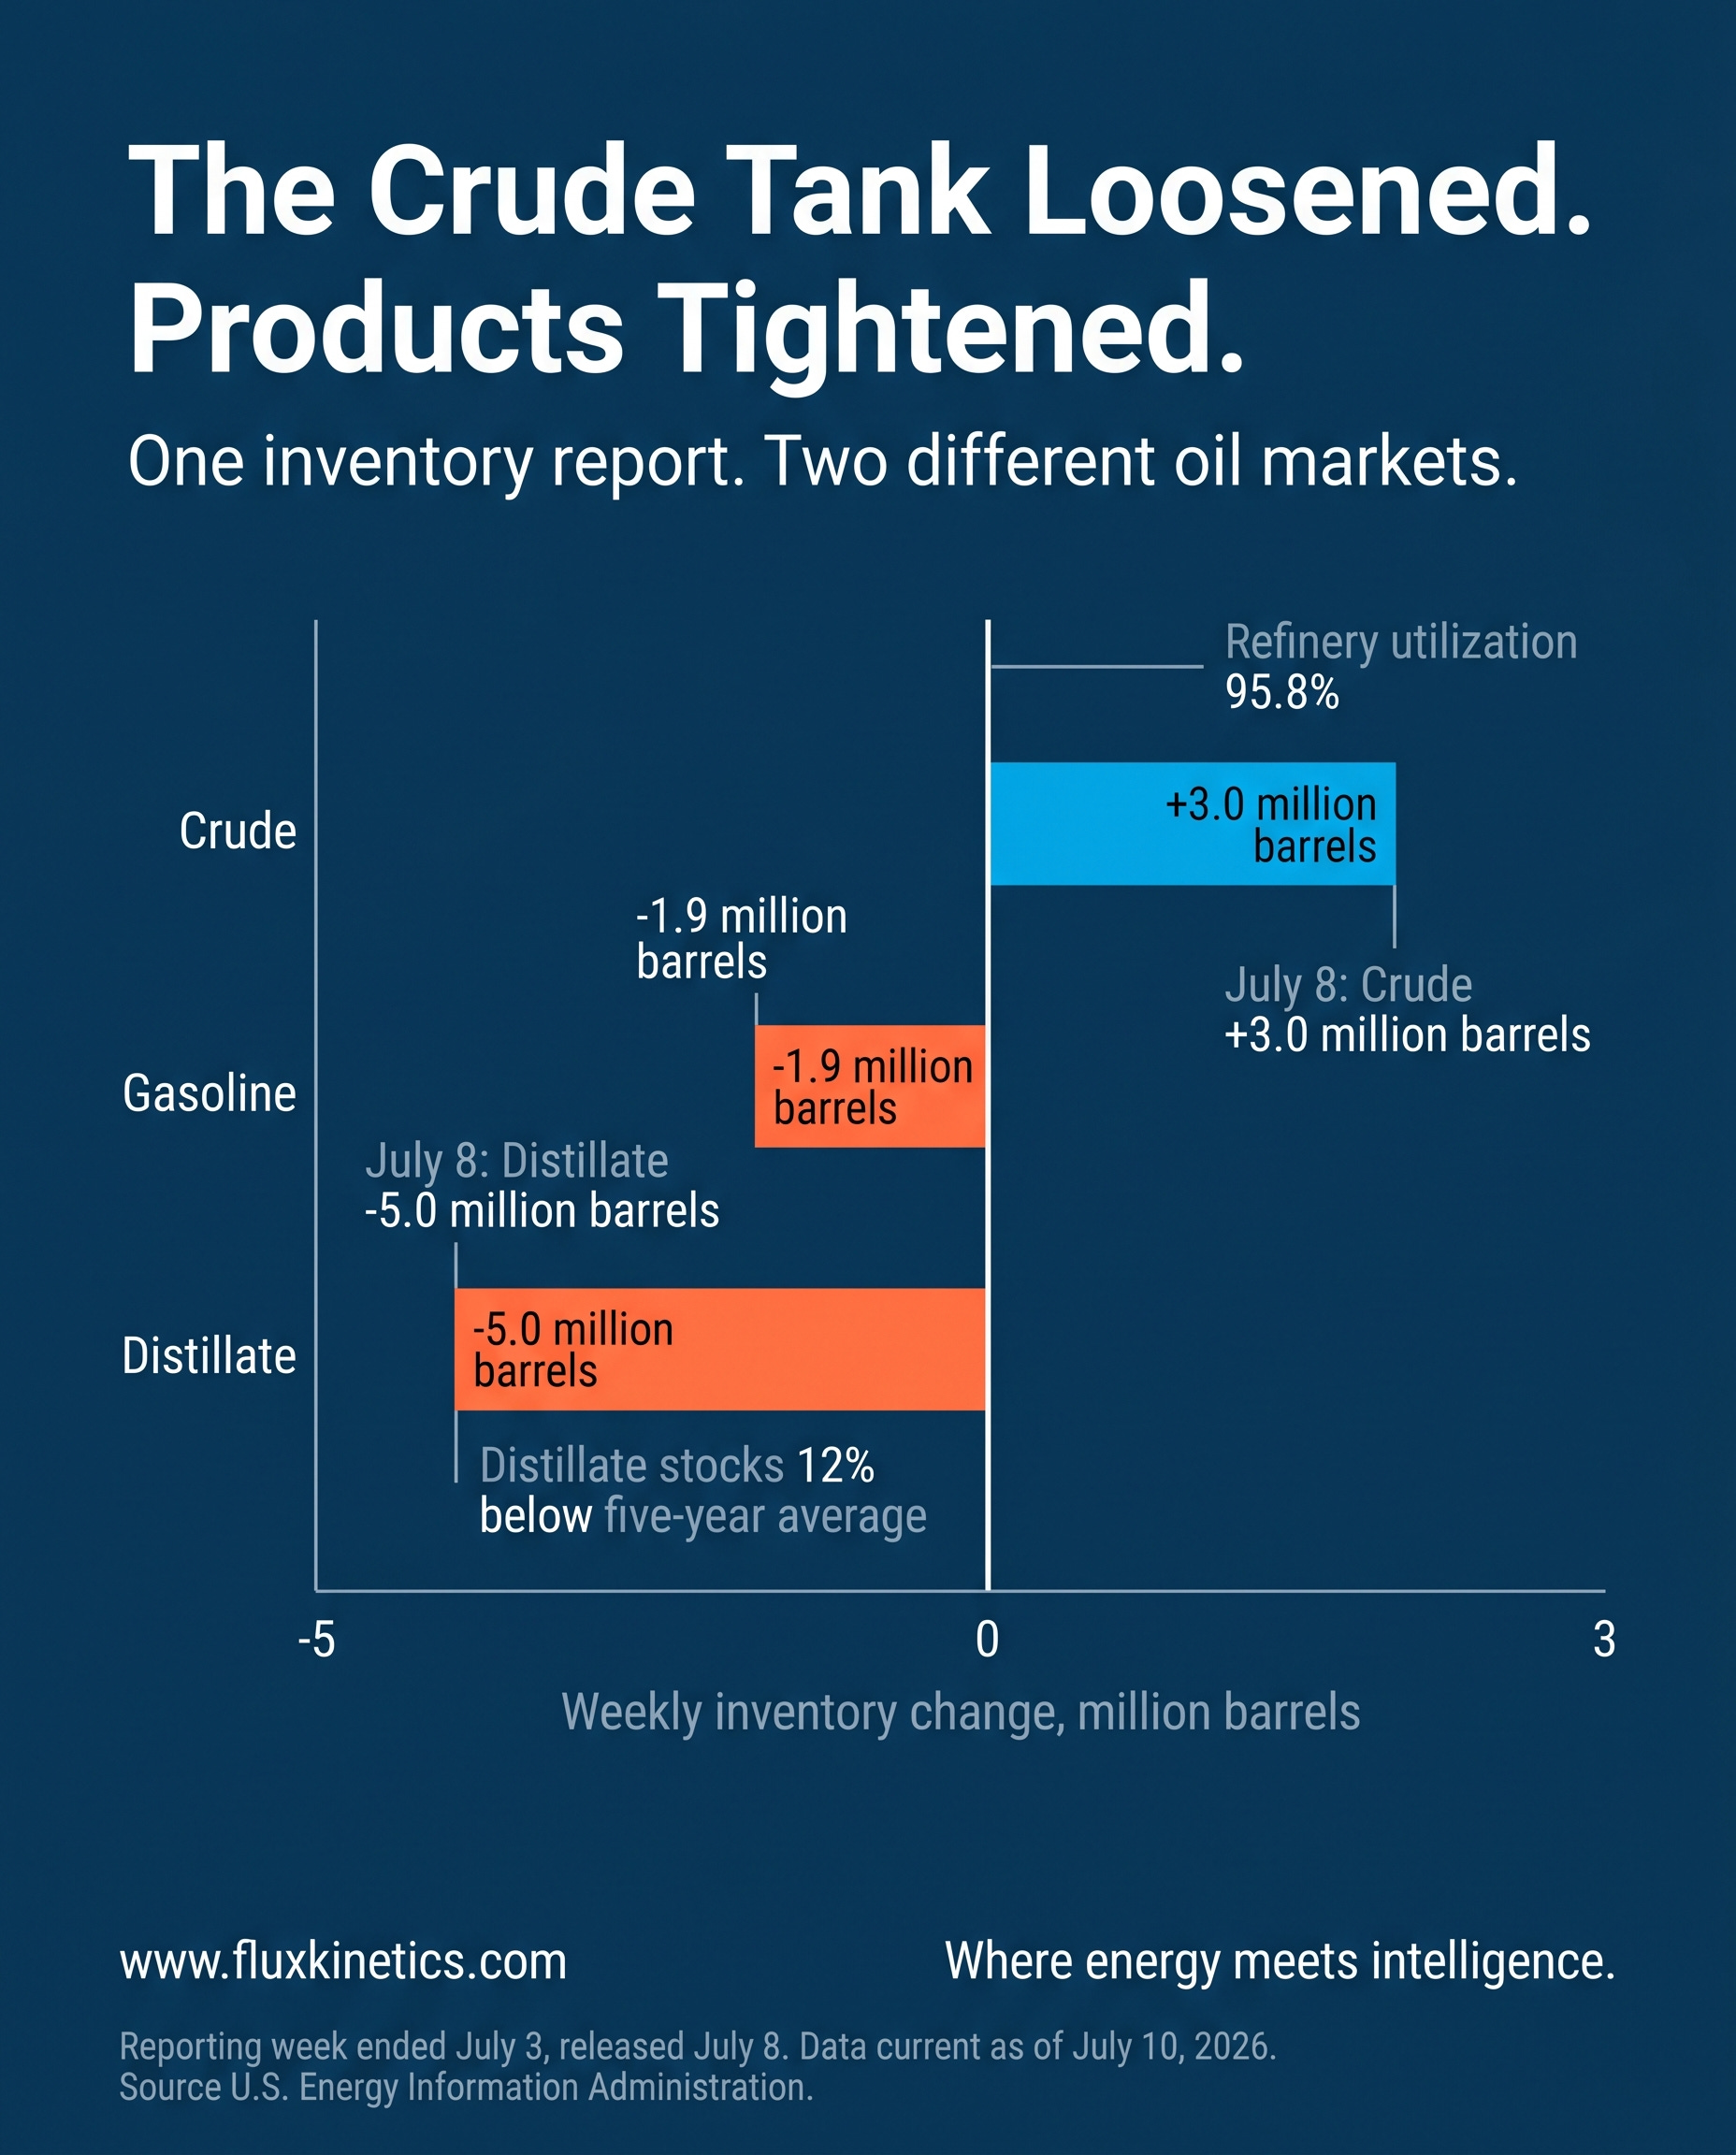
Gasoline inventories fell 1.9 million barrels to 212.1 million, leaving stocks 6% below their five-year average. Distillate fell 5.0 million barrels to 103.6 million, or 12% below normal. Gasoline supplied over the last four weeks was also 2.2% lower than the same period in 2025, so this move was not just a simple demand surge.
A refinery can hold crude while the market still runs short of diesel. Crude in a tank is feedstock. Diesel in a truck is usable energy.
Russia’s July 8 full Diesel export ban cut off extra supply from a market that already had very little stock left as a safety cushion. The key factor most headlines missed this week is how limited refineries are in changing their output mix. Simply adding more crude does not instantly create the exact fuel you need, in the exact port where it is needed :
A crude build cannot fill a diesel tank without refinery time.
The IEA’s July report also lowered its forecast for Russian oil production to 8.9 million barrels a day in 2026. That is a 3% decline. Taken together with the diesel ban, this means pressure is building on both crude supply and diesel supply, but on different timelines.
THE FLUX NUMBER: The 5.0 million-barrel distillate draw. It shattered the simple story that more crude in storage automatically means the whole U.S. oil market is getting looser.
Gas Splits In Two
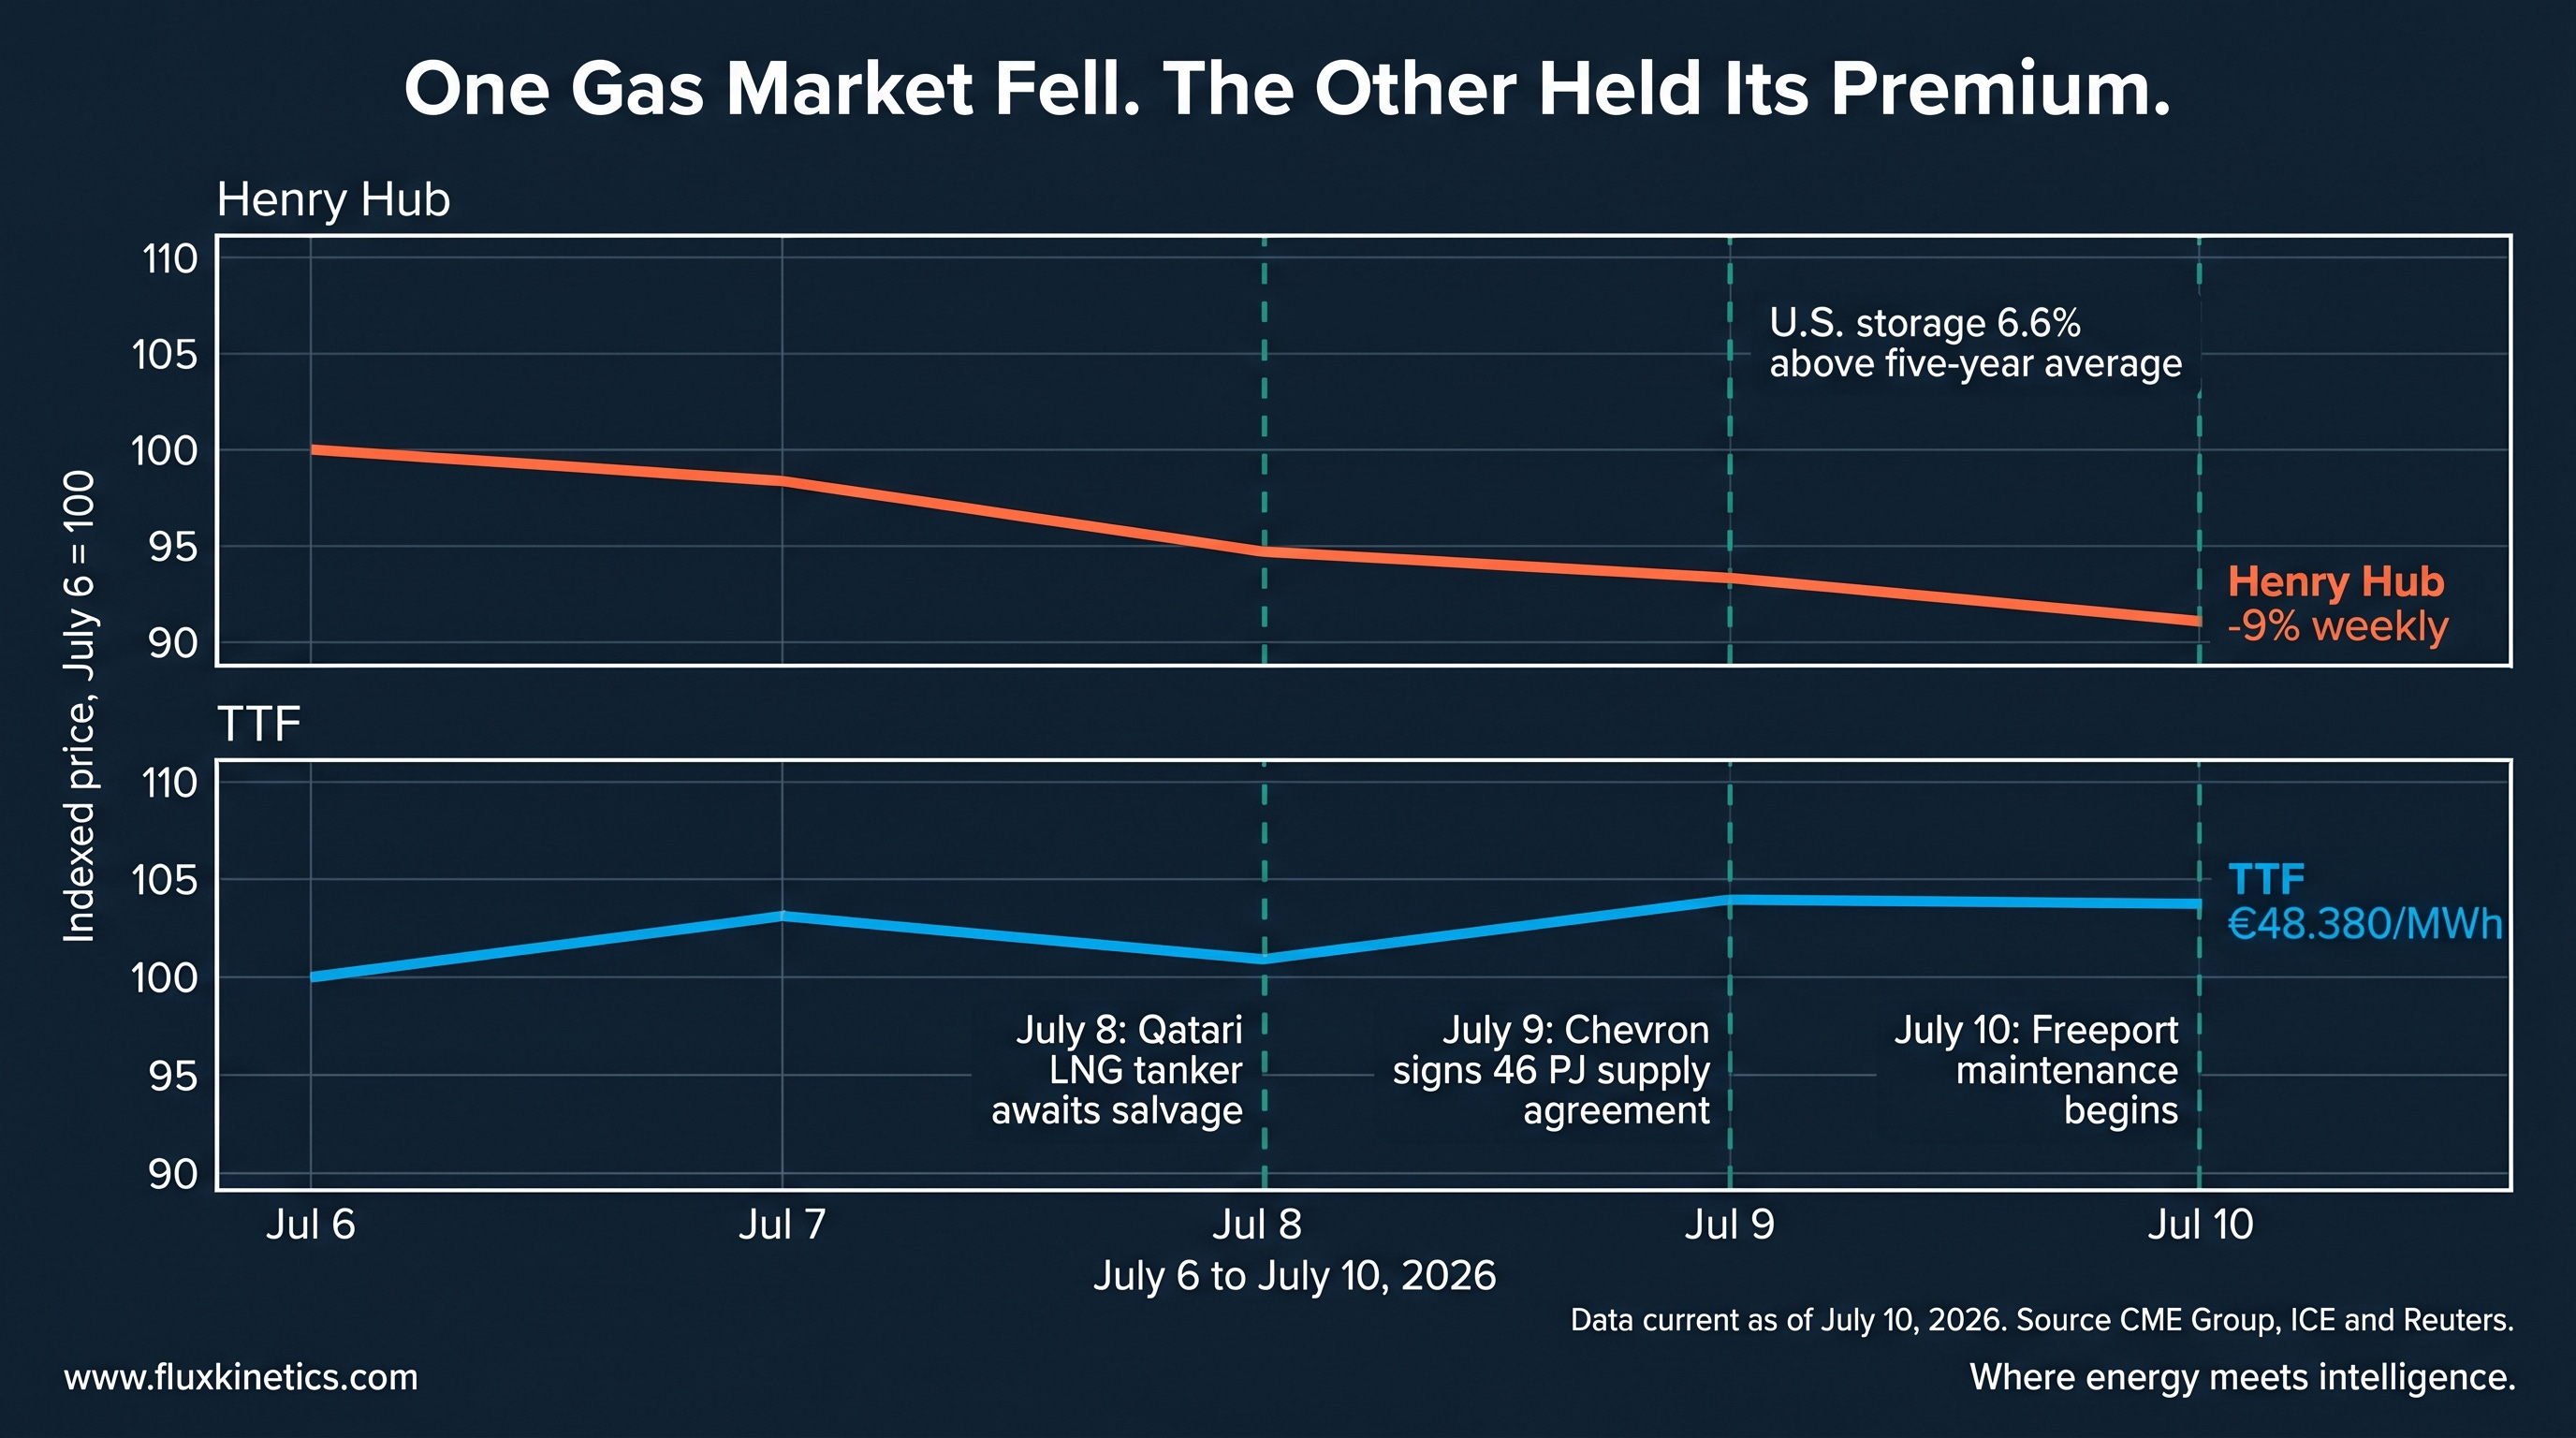
Henry Hub fell about 9% during the week to $2.888/MMBtu. The main reasons were milder weather forecasts, gas in storage running 6.6% above the five-year average, and planned maintenance at Freeport LNG’s export plant, which ships 2.4 billion cubic feet a day, from July 10 to late August.
European gas told a different story. The ICE August TTF contract ended Friday at €48.380/MWh. One market was pricing weaker gas flowing into export plants for now. The other kept a price premium because cargo supply and shipping routes still look tight.
Henry Hub shows the price of gas that is stuck behind limited export capacity. TTF shows the price of gas after it has been liquefied, shipped and turned back into gas.
On July 9, Chevron Australia signed a five-year agreement to supply Alinta Energy with 46 petajoules of gas beginning in July 2027. That contract locks in real gas supply before the market gets to the next big wave of new LNG export capacity.
Henry Hub weakness is current. Contracted gas demand is still building.
Gas is cheap before the liquefaction gate. The cargo is not.
THE FLUX KINETICS INSIDER VIEW: Stocks priced in the LNG expansion years ago. The real-world gas market is only now feeling the clash between plant maintenance, limited ships and growing long-term contracts.
Power Pulls The Metals
China’s peak power demand hit a record 1.518 billion kilowatts on July 10, according to the state planning agency. The new peak exceeded the previous record by 10 million kilowatts.
This is the point where demand for metals starts to follow the energy story. Record electricity use makes flexible power plants, grid scale storage, transformers and transmission lines more valuable. Copper does not gain much from one hot afternoon. It gains when grids need to be rebuilt to handle a permanently higher peak demand.
The LME three month copper closing price was $13,484.50 per tonne on July 10. CFTC data for July 7 showed non-commercial copper longs at 96,440 contracts and shorts at 32,168, leaving a net long position of 64,272 contracts. Net positioning slipped by 516 contracts from June 30.
Investor positions eased back even as real-world electricity demand set a new record.
In case you’ve missed my previous article about UAE exiting OPEC:

Hot weather passes quickly. A 1.5-terawatt peak changes equipment orders for years to come. If grid planners treat this summer’s load as the new normal, orders for transformers, cables and storage should stay high into the late 2020s.
THE LOAD: The last needed megawatt still comes from flexible power plants, with coal and gas doing most of the reliability work when cooling demand spikes.
Reserves Absorb The Shock
The U.S. Strategic Petroleum Reserve dropped by 6.2 million barrels to 319.5 million in the week ending July 3, according to the EIA. This decline pushed the reserve down to its lowest level since April 1983.
India moved the other way. ONGC approved a new strategic petroleum reserve in Mangalore of 1.75 million tonnes, equal to about 13 million barrels of crude.
One reserve released barrels. Another approved new tank capacity.
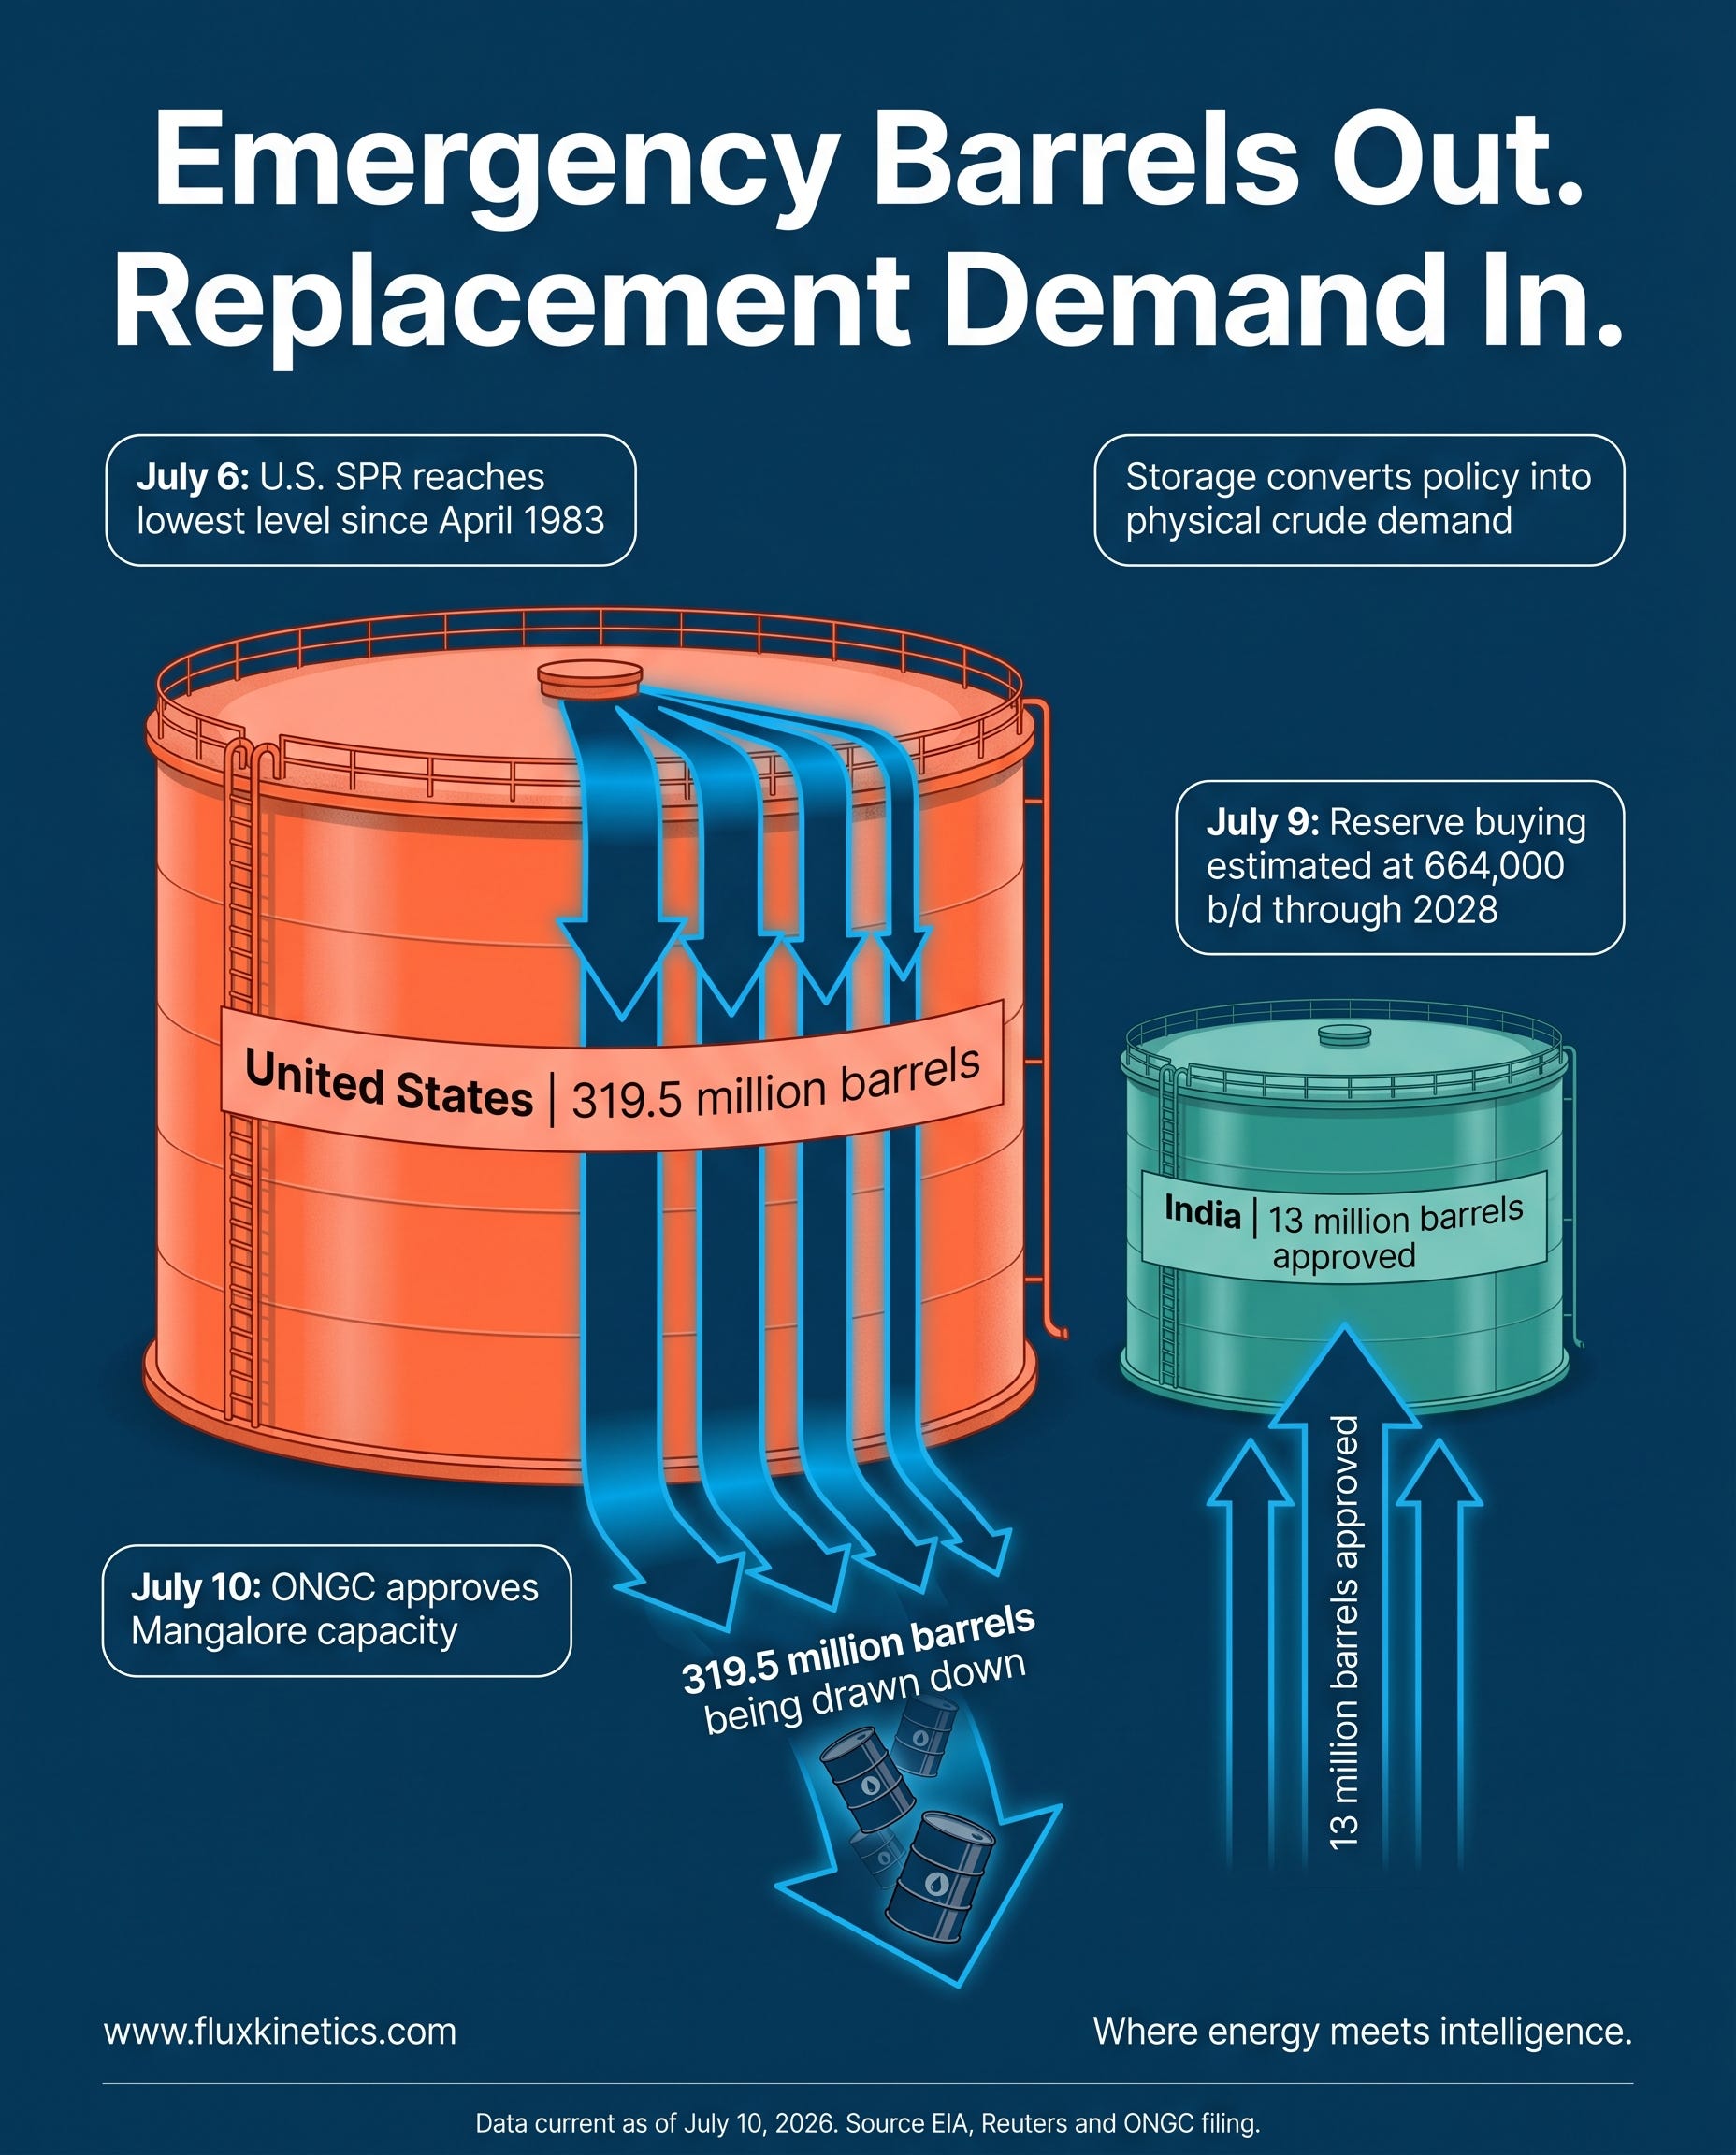
Government buying for reserves could add around 664,000 barrels a day of extra crude demand between now and 2028. This means government reserves are turning into a visible extra source of demand, not just a small policy detail.
The EIA’s July Short-Term Energy Outlook expects global oil inventories to build by an average of 2.7 million barrels a day, with Brent falling from an average of $103 in the second quarter to $70 in the fourth quarter. That forecast assumes today’s supply problems ease and that tight diesel and product markets do not make crude balances tighter.
If either of those assumptions proves wrong, the forecast will fail first at the refinery level.
THE FLUX KINETICS POLICY PULSE: Releasing reserves helps limit sudden price spikes. Filling those tanks back up later creates a second wave of demand after the crisis.
Week Ahead: What to Watch
1. Energy reports: OPEC MOMR (Jul 13), EIA petroleum (Jul 15), gas storage (Jul 16).
2. Macro: US CPI Tuesday Jul 14 : top oil-driven inflation catalyst; PPI, retail sales follow.
3. Positioning: Baker Hughes rigs and CFTC copper length, both Jul 17.
The week’s central signal was simple. Crude rose, but the real shortage sat inside the finished barrel.
Coming next:
Russia’s Diesel Didn’t Vanish…
⚡ One last thing
If this changed how you see the week, send it to one person who needs to see it too. That is how Flux Kinetics grows. Reader by reader, not algorithm by algorithm.
📨 Share • 📬 Subscribe • 💬 Leave a comment
Flux Kinetics - Where Energy Meets Intelligence.
Wassim CHIADLI
This content is for educational purposes only and does not constitute financial, legal, or tax advice. All opinions and analyses are my own, and any actions you take are at your own risk after consulting an appropriate professional.
This is exactly the kind of analysis I enjoy reading because it comes from someone who understands the industry from the inside, not from headlines.
After more than 30 years bringing products to market, I have learned that the numbers almost always tell a deeper story than the narrative. The market reacts to emotion. Professionals study the underlying data.
What I appreciate about your work is that you separate price from reality. Anyone can comment on where oil closed. It takes experience to explain why the physical market is telling a different story than the paper market.
That ability to connect inventory, refinery utilization, diesel demand, logistics, and market psychology into one clear picture is what makes real expertise valuable.
Thank you for continuing to educate those of us who enjoy understanding what is really happening beneath the surface. Posts like this remind me that every industry has signals most people never see until someone with experience points them out.