

Brent Ran 8%. Silver Got Hit 9% In A Day.
What you need to know this week.

Paper signaled. Physical delivered. Friday picked a side
Dear Executives, Traders, Investors, and Friends
Sunday, 5am. Coffee is cold but the weather is warm in Doha and the screens are still blinking from Friday’s close.
Oil ripped higher all week. Silver and gold got hammered on Friday.
Same tape. Same macro… Two opposite stories.
The simple version: oil moved because the tanks drew. US crude inventories fell by 4.3 million barrels, deeper than the market expected. Gasoline drew too. Refineries ramped up. That is the operational signature of summer demand arriving early.
The headline lit the match. Inventory supplied the fuel.
Brent finished near $109.26 per barrel, up about 8.1% on the week. WTI closed near $101.02, up roughly 6%. OPEC+ is only adding 188,000 barrels per day in June. US oil rigs remain well below where they were two years ago.
Less incremental supply than feared, and more demand than modeled…
The path of least resistance moved higher.
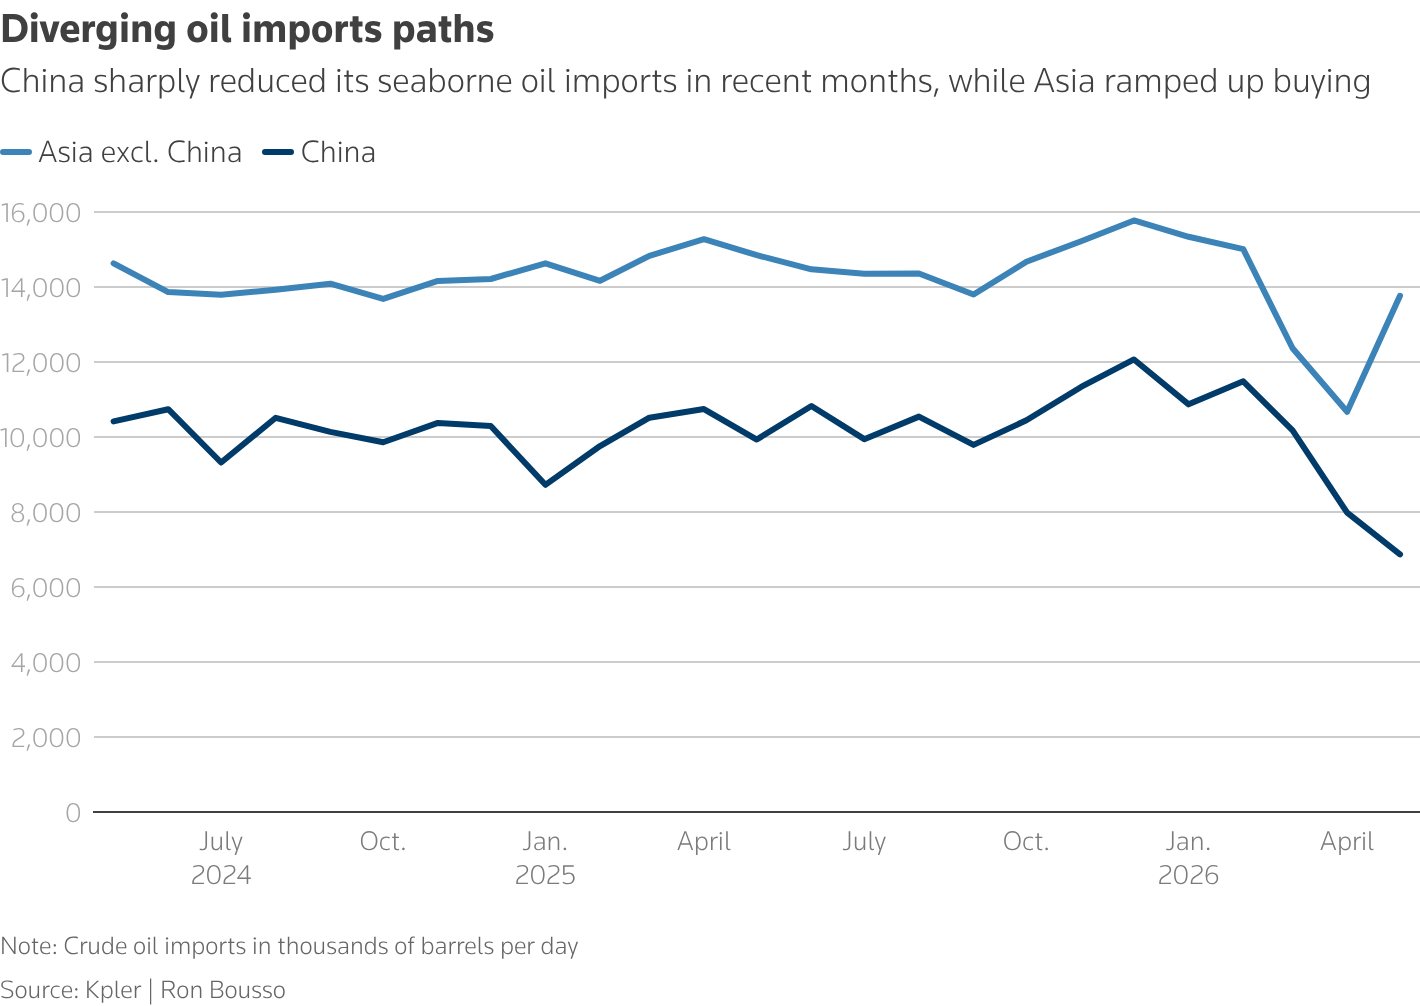
The US-China visit added a commercial signal, not a geopolitical one. China remains the world’s largest crude importer and the largest LNG buyer. The US has barrels, LNG capacity, and Gulf Coast export infrastructure. If commercial channels reopen even partially, the first impact shows up in cargo routes, tariff math, freight, and Gulf Coast differentials.
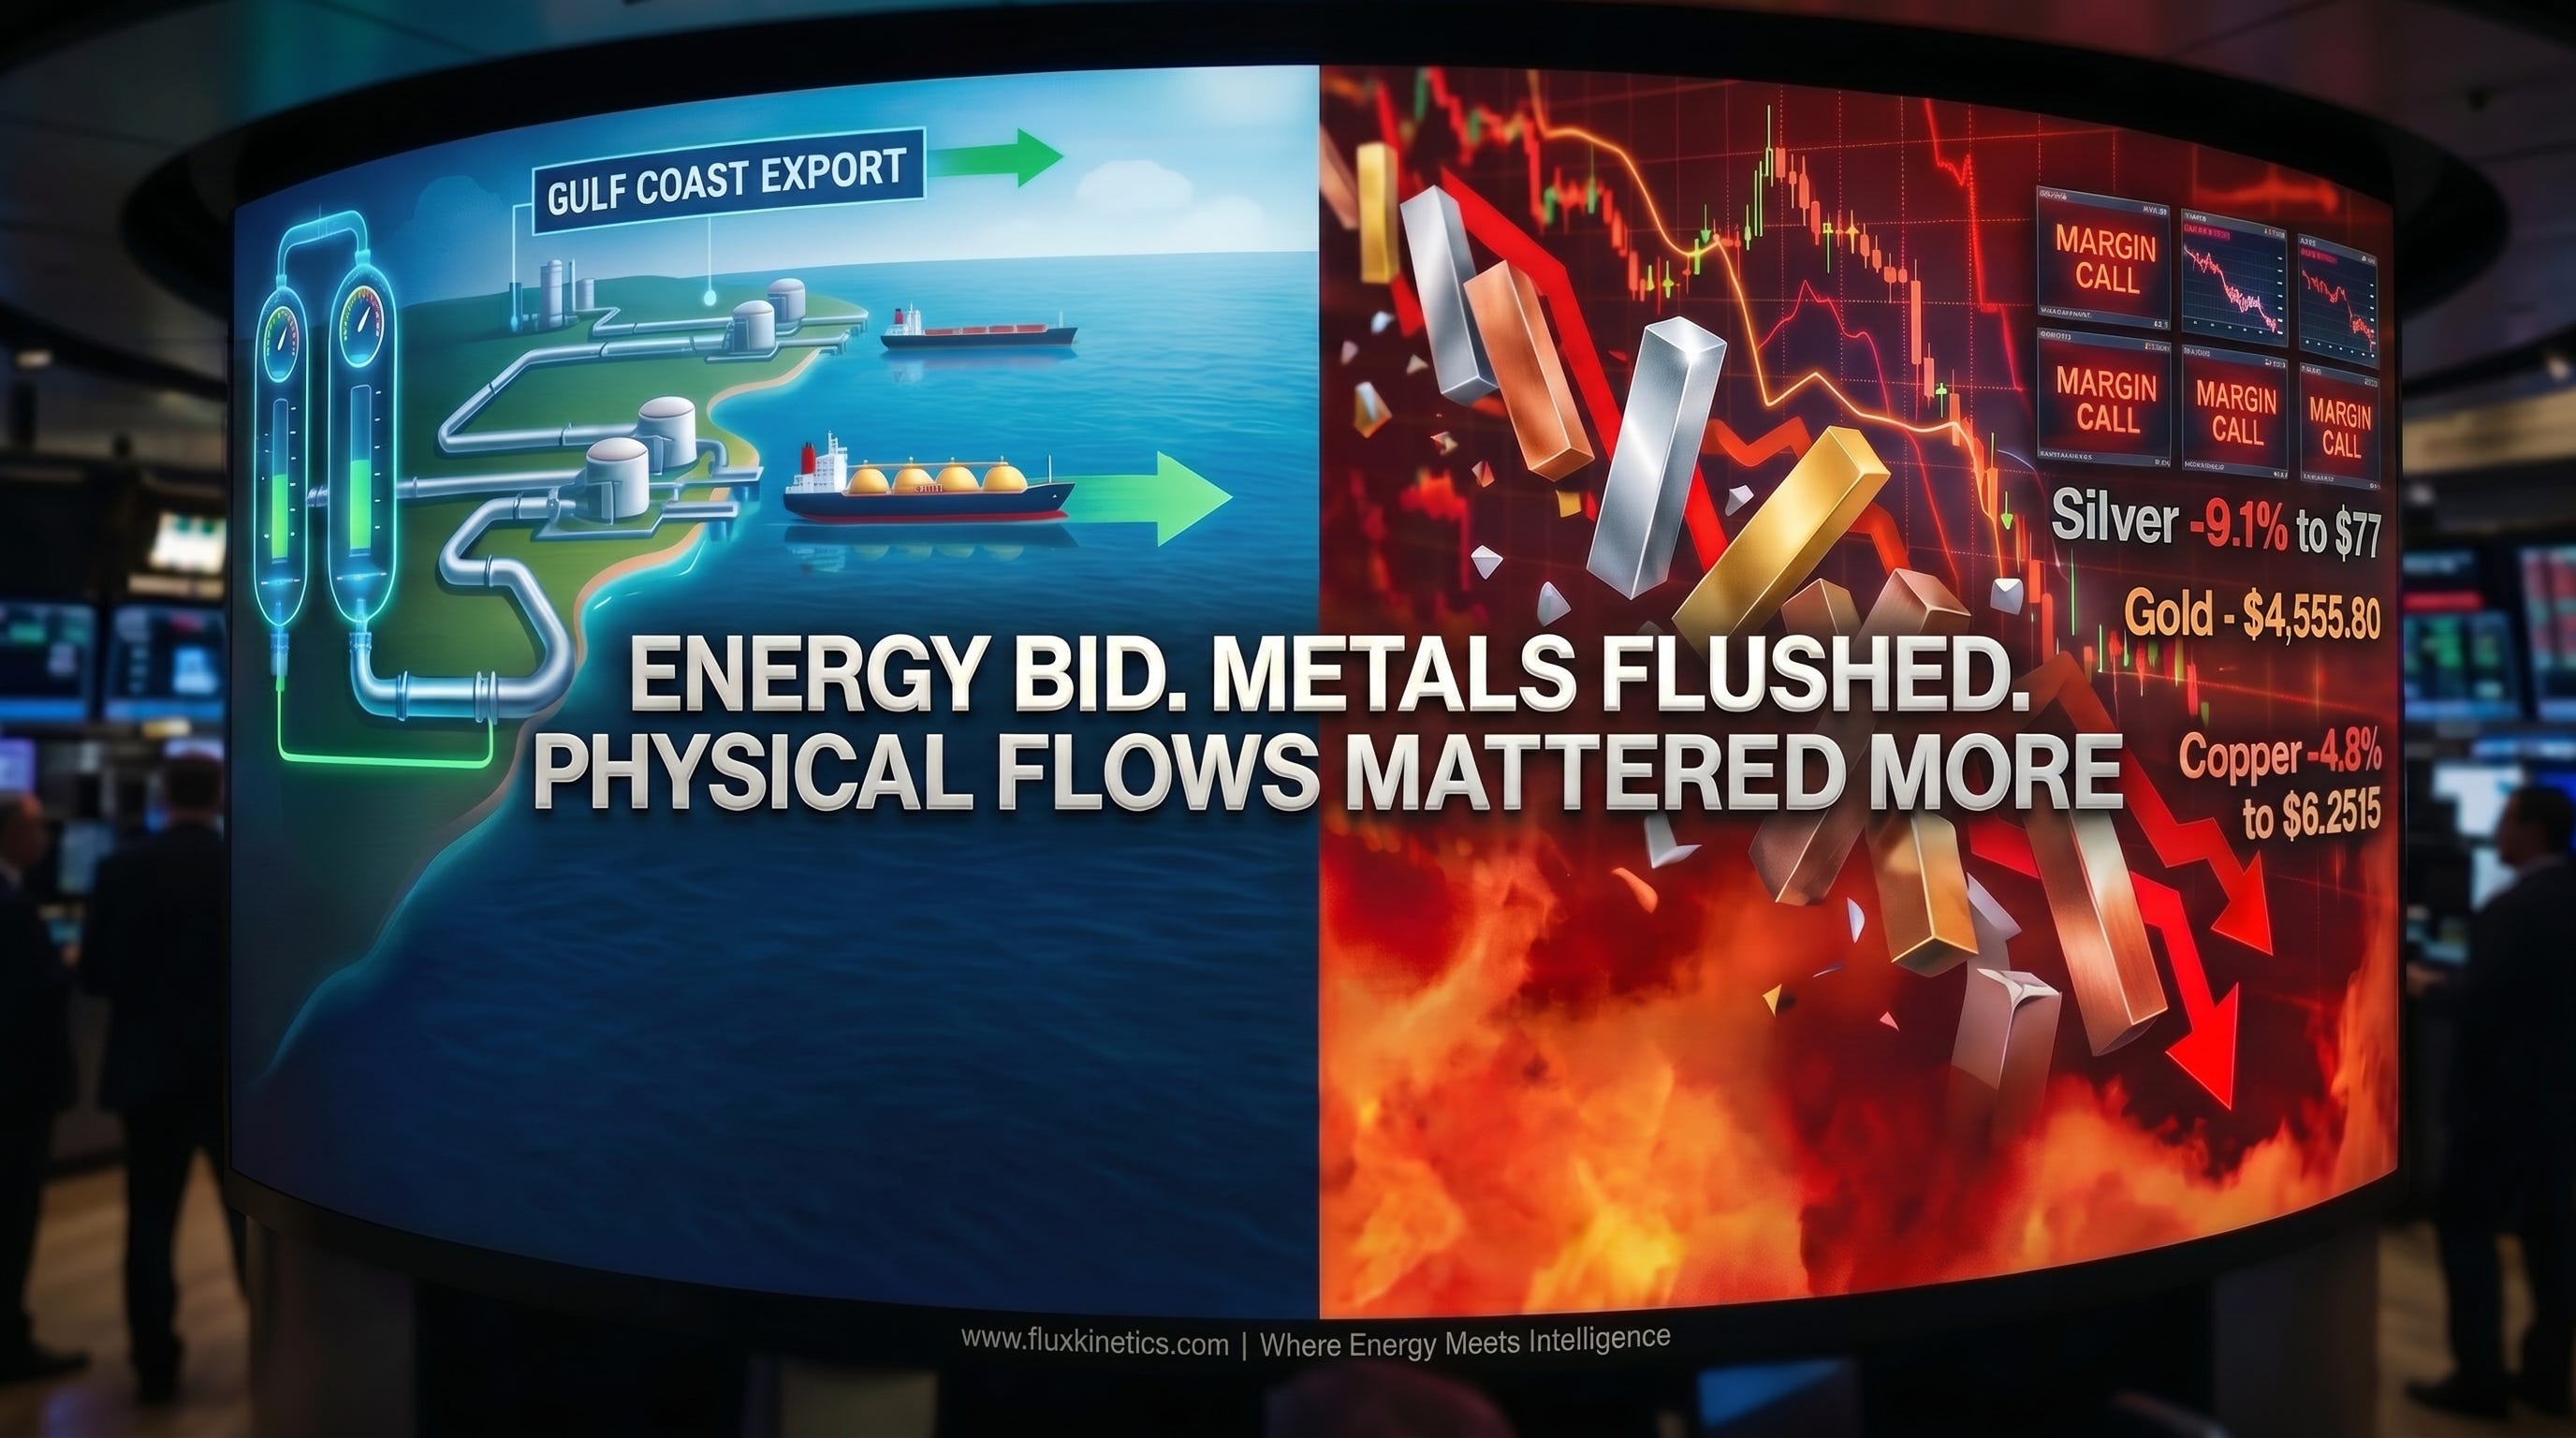
Energy bid. Metals flushed. Physical flows mattered more than headlines…
This Week’s Settle
Brent crude closed near $109.26/bbl, up roughly 8.1% on the week.
WTI crude closed near $101.42/bbl, up about 6%.
Henry Hub natural gas finished near $2.96/MMBtu.
Dutch TTF closed near €50.45/MWh, roughly $15/MMBtu equivalent.
JKM Asian LNG was assessed near $18.47/MMBtu.
The pattern: energy bid, metals dumped.
Gold settled at $4,555.80/oz, down 2.6% Friday and 3.5% on the week.
Silver fell about 9.1% Friday, settling near $77/oz.
Copper settled near $6.2515/lb, down about 4.8% Friday but almost flat on the week.
China lithium carbonate closed around 191,000 to 192,000 yuan per ton, still up nearly 198% year-on-year.
🔁 Found this useful?
Flux Kinetics runs on word of mouth. If this note sharpened how you see the week, one forward to the right person is worth more than any algorithm.
THE OIL STORY
Oil ran because the physical balance tightened.
The EIA print showed a 4.3 million barrel crude draw. That was the number that broke consensus. A larger crude draw, a gasoline draw, and stronger refinery runs told the same story: barrels are leaving tanks faster than expected.
Here is the catch. The front of the oil curve ripped. The back barely moved as shared previously. December 2027 Brent still sits far below the prompt contract. That shape is backwardation, as explained last week : It says the spot market is tight while the long-term market is not yet buying a full-cycle shortage.
Plain English: producers can sell forward at strong prices and lock in margin. The smart money is hedging the spike, not marrying it.
The China angle matters through trade flow, not politics. China has not been a meaningful buyer of US crude recently because tariffs and economics blocked the route. At the peak in 2020, US crude exports to China reached roughly 395,000 barrels per day. By 2024, that had already fallen to about 193,000 barrels per day.
So the immediate impact is not a demand flood. It is the possible reopening of a route.
If the economics clear, Gulf Coast barrels get another major buyer in the stack. That matters for WTI-linked crude, export terminals, tanker demand, Gulf Coast differentials, and the Brent-WTI spread.
THE LNG STORY
LNG is simple. Cool gas to around -160°C, turn it into liquid, shrink it by about 600 times, and ship it across oceans.
The US has spent the last decade building expo rt capacity on the Gulf Coast. Golden Pass is bringing Train 1 online. Corpus Christi Stage 3 is ramping trains 5 through 7. Together, they add about 2.1 Bcf/d of new export capacity through the back half of 2026 and into 2027.
That matters because Henry Hub is near $2.96/MMBtu, while TTF is around $15/MMBtu equivalent and JKM is near $18.47/MMBtu. Same molecule. Different destination. Very different price.
Every new LNG train that runs hot pulls more gas off the US domestic balance and sends it into the global market.
China is the swing signal. It still has a tariff wall around US LNG, so the issue is not demand alone. It is netback.
Tariffs change economics.
Economics decide cargo flow.
🔁 Found this useful?
Flux Kinetics runs on word of mouth. If this note sharpened how you see the week, one forward to the right person is worth more than any algorithm 📨
Two things matter from here: whether US LNG cargoes actually discharge in China, and whether Chinese buyers accelerate term contracts already signed with US projects.
Forget the speeches. Watch cargo destinations, feed gas flows, and contract start dates.
“The signal is in the feed gas meter, not the next earnings call.”
THE METALS FLUSH
Friday hit metals like a margin call.
Gold settled at $4,555.80/oz, down 2.6% on the day. Silver dropped about 9.1%, settling near $77/oz. Copper fell about 4.8% to $6.2515/lb.
This was positioning, not physics.
When too many traders hold the same leveraged position and price turns against them, brokers force selling. That selling creates more selling and the unwind happens in hours…
Gold tested the $4,700 resistance shelf earlier in the week, then flushed back into the mid $4,500s. That is not automatically the trend breaking. That is the trend exhaling.
Silver needs to reclaim $80 to repair momentum. Copper needs to reclaim $6.55. Until then, patience beats prediction.
Lithium is different. China battery-grade lithium carbonate sits around 191,000 to 192,000 yuan per ton, up nearly 198% year-on-year. EV demand and grid-scale storage are still pulling material. Supply cannot respond inside two quarters.
“Don’t confuse the position flush with the cycle break. One is plumbing. The other is physics.”
My Flux Kinetics Trade (GOLD):
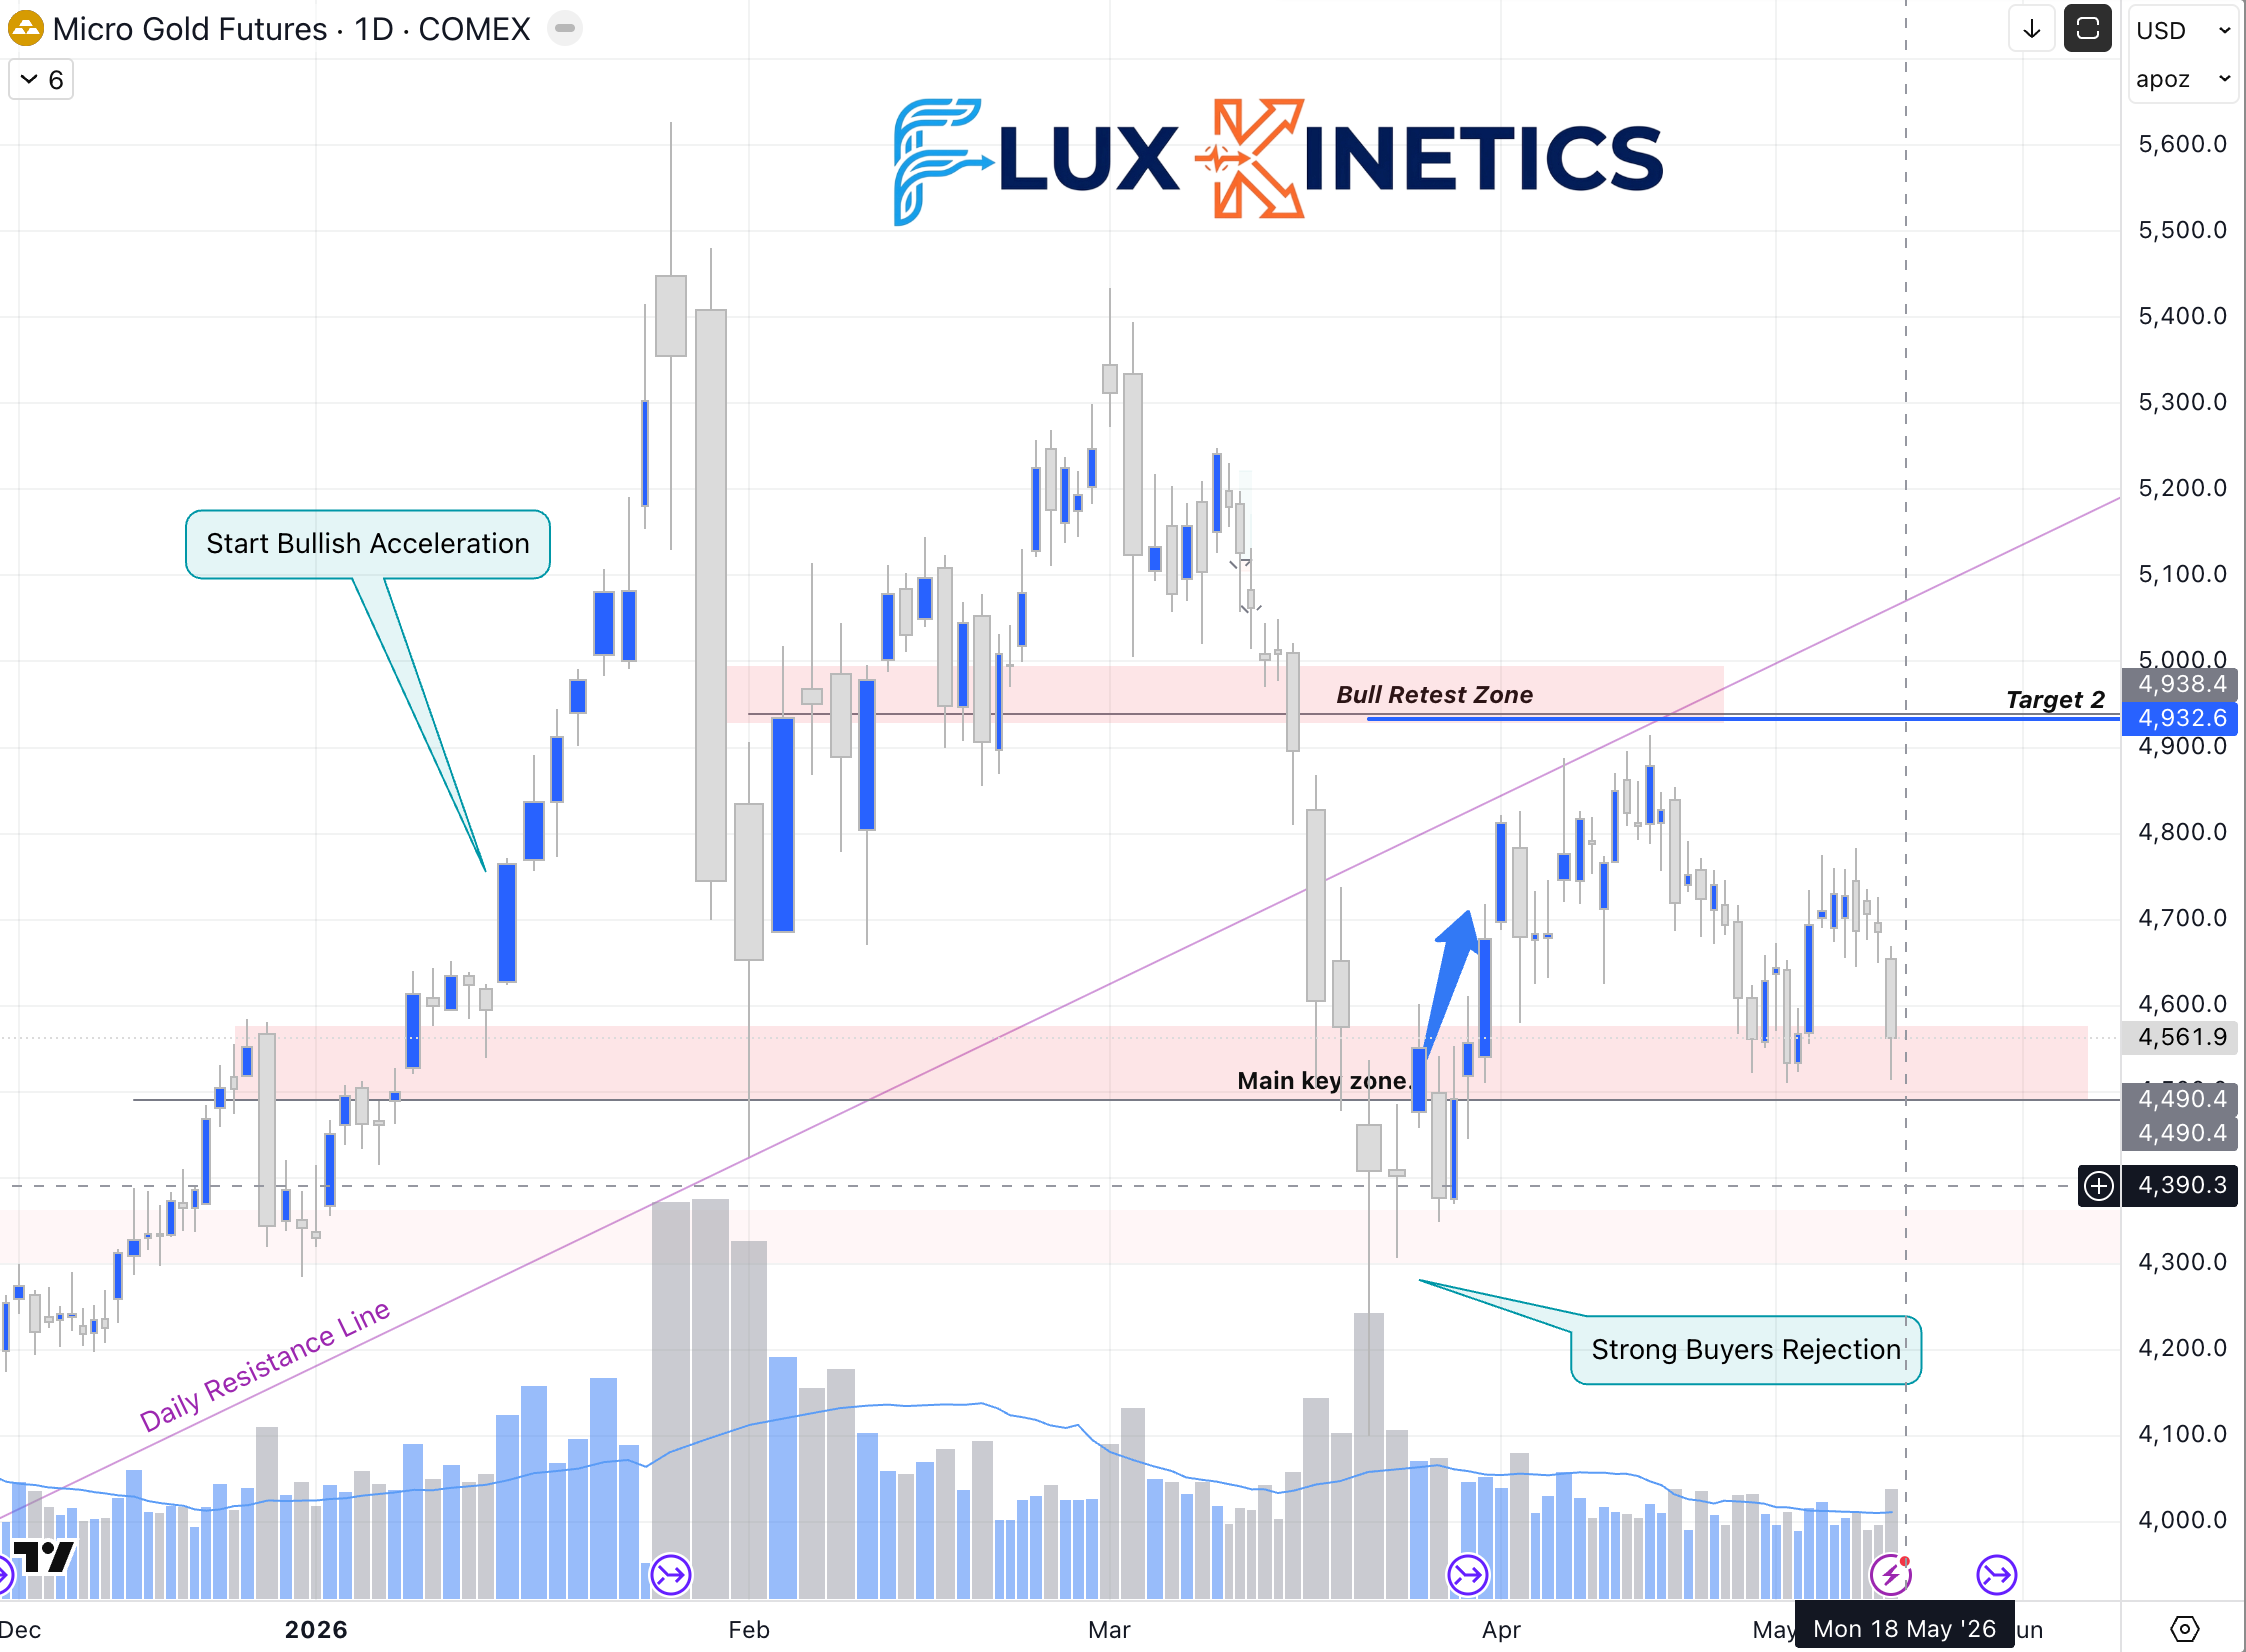
Last week we didn’t give any idea on purpose, volatility was present... Gold lost almost 4% with a strong Friday day.
As now we are on the main key zone, if 4,500$ level is protected, and we start to see a bounce on that level. A long can be taken towards 4,670$ with a short stop below 4,485$.
However, if we see that there is no strong momentum to reverse, then a price break below the main key zone (meaning below 4,490) can activate a short toward 4,400.
With a safer perspective, I would wait for 4,363 as the level to potentially enter a long if there is a strong buyer volume.
CHOKEPOINTS AND CAPITAL FLOWS
Three bottlenecks matter.
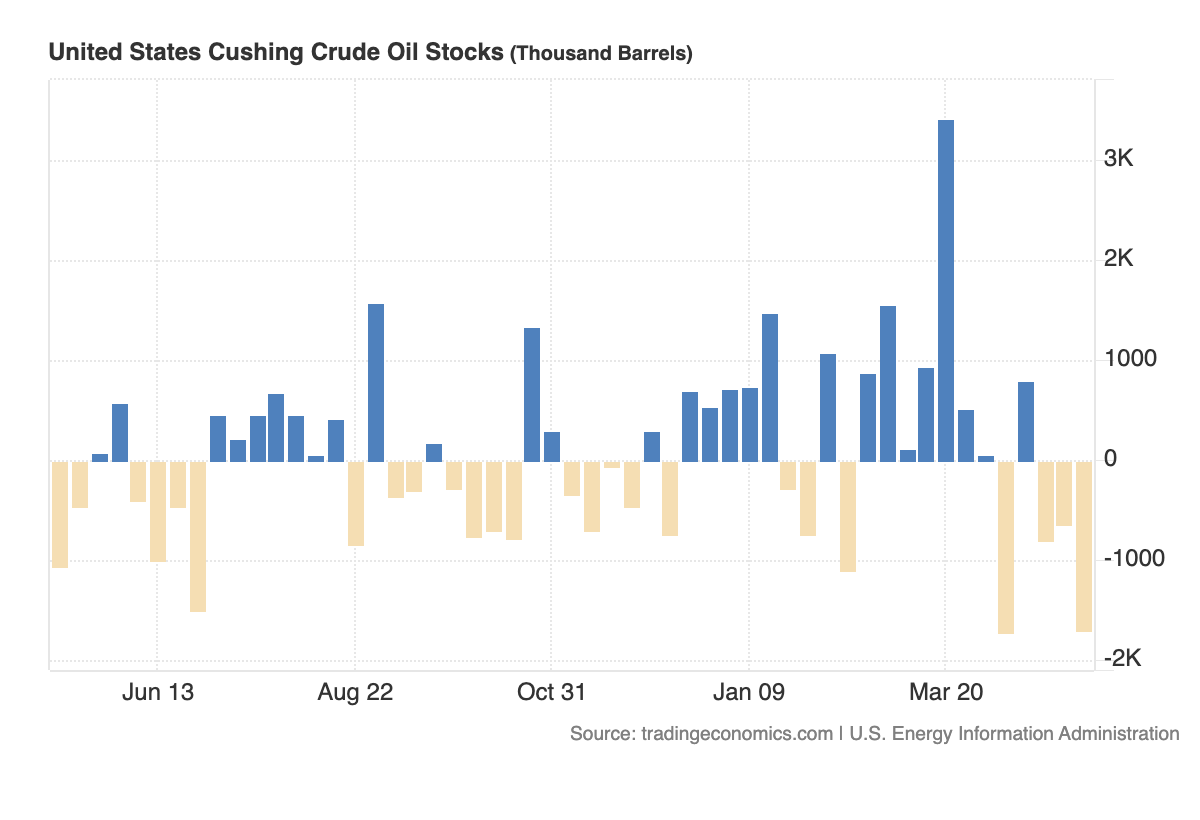
First, Cushing. Inventory there becomes operationally sensitive as it approaches the low 20 million barrel area. With refinery runs rising and crude drawing, Cushing is tightening.
Second, Gulf Coast feed gas pipelines. The bottleneck is not only the LNG plant. It is the steel between the Permian, Texas demand centers, and the coast.
Third, silver float. Industrial demand is large. Investable metal is thinner than the paper position built on top of it.
Capital flowed toward US midstream and disciplined upstream names using the back of the curve to lock in 2027 cash flow. Capital fled weak-balance-sheet silver beta.
Plumbing one way. P&L the other.
WEEK AHEAD
Watch four things.
EIA crude inventories. Was the 4.3 million barrel draw a one-week shock or the start of a summer pattern?
Cushing. If stocks keep falling, WTI structure matters more.
LNG feed gas. If feed gas rises and Henry Hub stays below $3, supply can absorb the pull. If Henry Hub moves, the export bid is biting.
Metals levels. Silver needs $80. Copper needs $6.55. Gold needs to hold the mid $4,500s.
Final word: the physical market remains the referee.
Paper can chase the headline.
Cargoes, tanks, pipes, and contracts tell the truth.
⚡ One last thing
If this changed how you see the week, send it to one person who needs to see it too. That is how Flux Kinetics grows. Reader by reader, not algorithm by algorithm.
📨 Share • 📬 Subscribe • 💬 Leave a comment
Flux Kinetics - Where Energy Meets Intelligence.
Wassim CHIADLI
This content is for educational purposes only and does not constitute financial, legal, or tax advice. All opinions and analyses are my own, and any actions you take are at your own risk after consulting an appropriate professional.
The gold and silver action this week shows that paper markets can create drama far faster than physical reality changes. A 9% silver flush in a single day looks catastrophic on a screen, yet industrial demand, monetary uncertainty, and the finite nature of actual metal did not suddenly disappear between Thursday and Friday.
I liked your distinction between “plumbing” and “physics.” Too many people mistake leveraged positioning unwinds for a complete change in underlying reality. The deeper forces driving interest in hard assets are very much alive beneath the noise.